Contents
[Step 0] Advance preparation
[Step 1] Create a DynamoDB table
[Step 2] Get IAM Access Key
[Step 3] Login with your IoT.kyoto VIS account
[Step 4] Create a graph
[Option 1] Change graph settings
[Option 2] Set thresholds
[Option 3] Search past data
[Option 4] Download data in CSV file
[Option 5] Rearrange panels
[Option 6] Delete graph
[Step 0] Advance preparation
Things to prepare in advance
- IoT device (outputs the measured value)
- AWS account
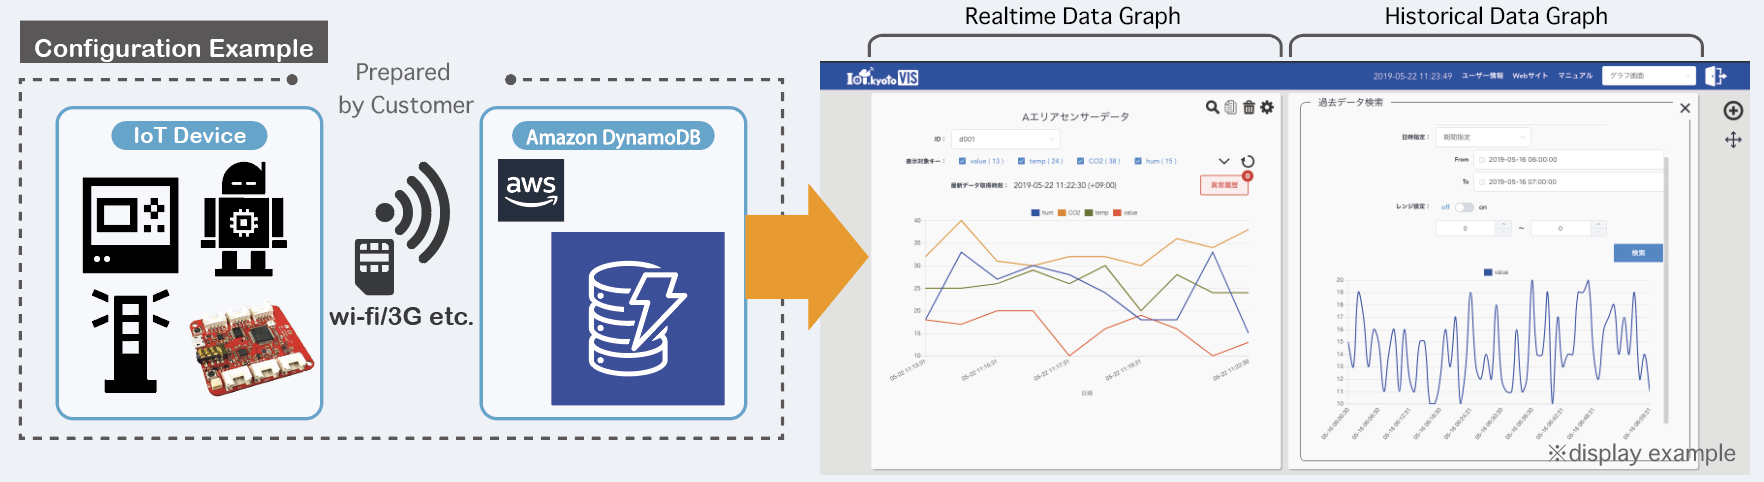
1. IoT.kyoto VIS configuration example
The following is a configuration example with IoT.kyoto VIS; note that your data has to be in Amazon DynamoDB in order to use IoT.kyoto VIS.
2. Data required to use IoT.kyoto VIS
Below shows the data required for IoT devices that output temperature and illuminance, as an example.
- ID and timestamp are required. ID identifies the connected IoT device, and timestamp identifies the time of measurement, recording etc of each data.
- In the table below, “temperature” and “light” are the measured values output from the IoT device.
-
The data from the IoT device is transmitted and stored in a DynamoDB table in [Step 1] Create a DynamoDB table. In addition, you can make a line graph of the data in real time in [Step 4] Create a graph.
deviceID time temperature light 01 2016-03-04T10:17:44Z 25.6 103 02 2016-03-04T10:17:44Z 22.1 216 01 2016-03-04T10:17:45Z 25.8 98 02 2016-03-04T10:17:45Z 21.9 210 - Use one of the following timestamps; display time on a graph will be automatically converted to the local time zone you set (default is +09:00).
[UTC]
  YYYY-MM-DDThh:mm:ssZ
  YYYY-MM-DDThh:mm:ss.sssZ
  YYYY/MM/DDThh:mm:ssZ
  YYYY/MM/DDThh:mm:ss.sssZ
  UNIX timestamp(Integer 10 digits)
  UNIX timestamp(Integer 13 digits)
[Others]
  YYYY-MM-DD hh:mm:ss
  YYYY-MM-DD hh:mm:ss.sss
  YYYY-MM-DDThh:mm:ss+hhmm
  YYYY-MM-DDThh:mm:ss+hh:mm
  YYYY-MM-DDThh:mm:ss.sss+hhmm
  YYYY-MM-DDThh:mm:ss.sss+hh:mm
  YYYY/MM/DD hh:mm:ss
  YYYY/MM/DD hh:mm:ss.sss
  YYYY/MM/DDThh:mm:ss+hhmm
  YYYY/MM/DDThh:mm:ss+hh:mm
  YYYY/MM/DDThh:mm:ss.sss+hhmm
  YYYY/MM/DDThh:mm:ss.sss+hh:mm
3. How to write data to a DynamoDB table
- Export device ID / timestamp / measurement value in JSON format as below.
- Convert to JSON format in case of CSV etc.
{"light": 164, "ID": "id000", "time_sensor": "2016-03-28 15:16:48"}
{"light": 692, "ID": "id000", "time_sensor": "2016-03-28 15:16:49"}
- Write data to a DynamoDB table by the following method. (Please also refer to Implementation example)
- Use API.
- Use SDK for various languages.
- Use AWS CLI.
- Write via AWS services such as AWS IoT and Lambda.
- Use middleware such as Fluentd.
- Use an ETL tool such as DataSpider (OK even if it is not JSON).
- Please refer to AWS developer resources for API / SDK.
[Step 1] Create a DynamoDB table
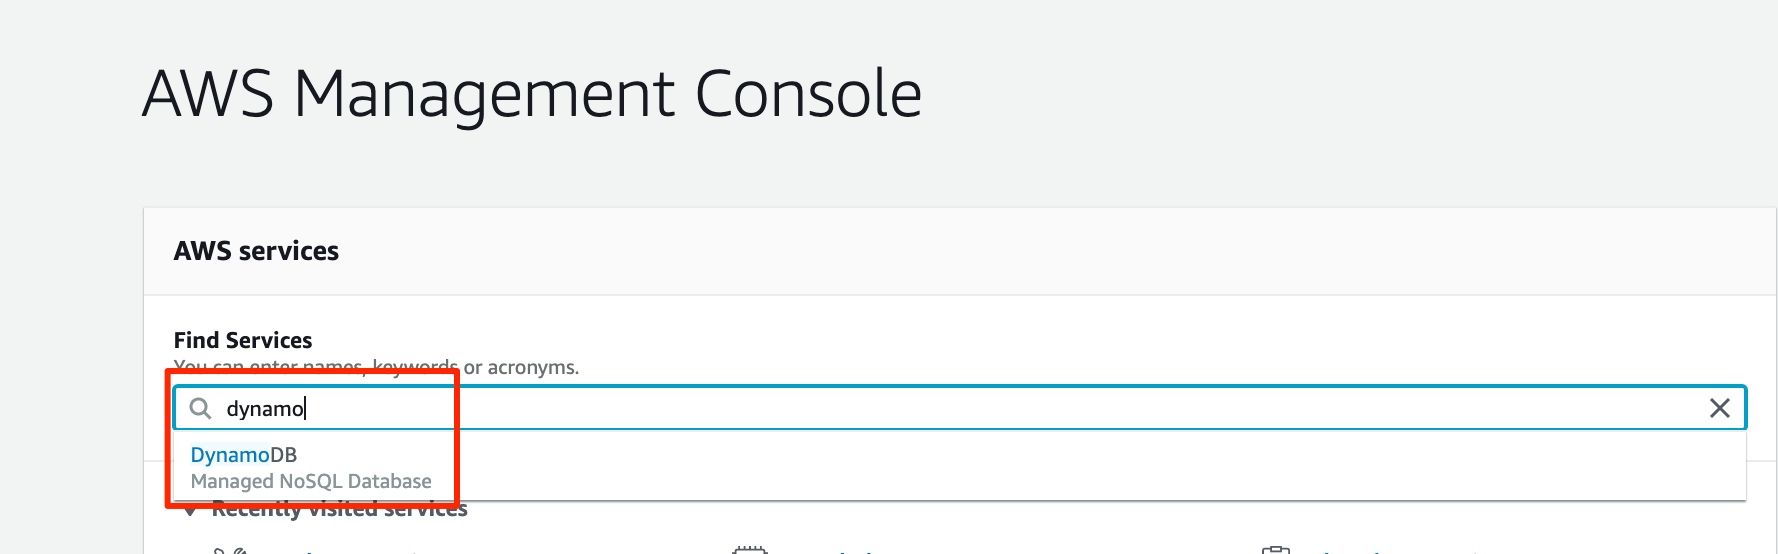
1. Sign in to the AWS Management Console.
- Log in to the AWS Management Console.
- Enter “dynamo” in the “Find Services” field of the AWS Management Console and select “DynamoDB”.
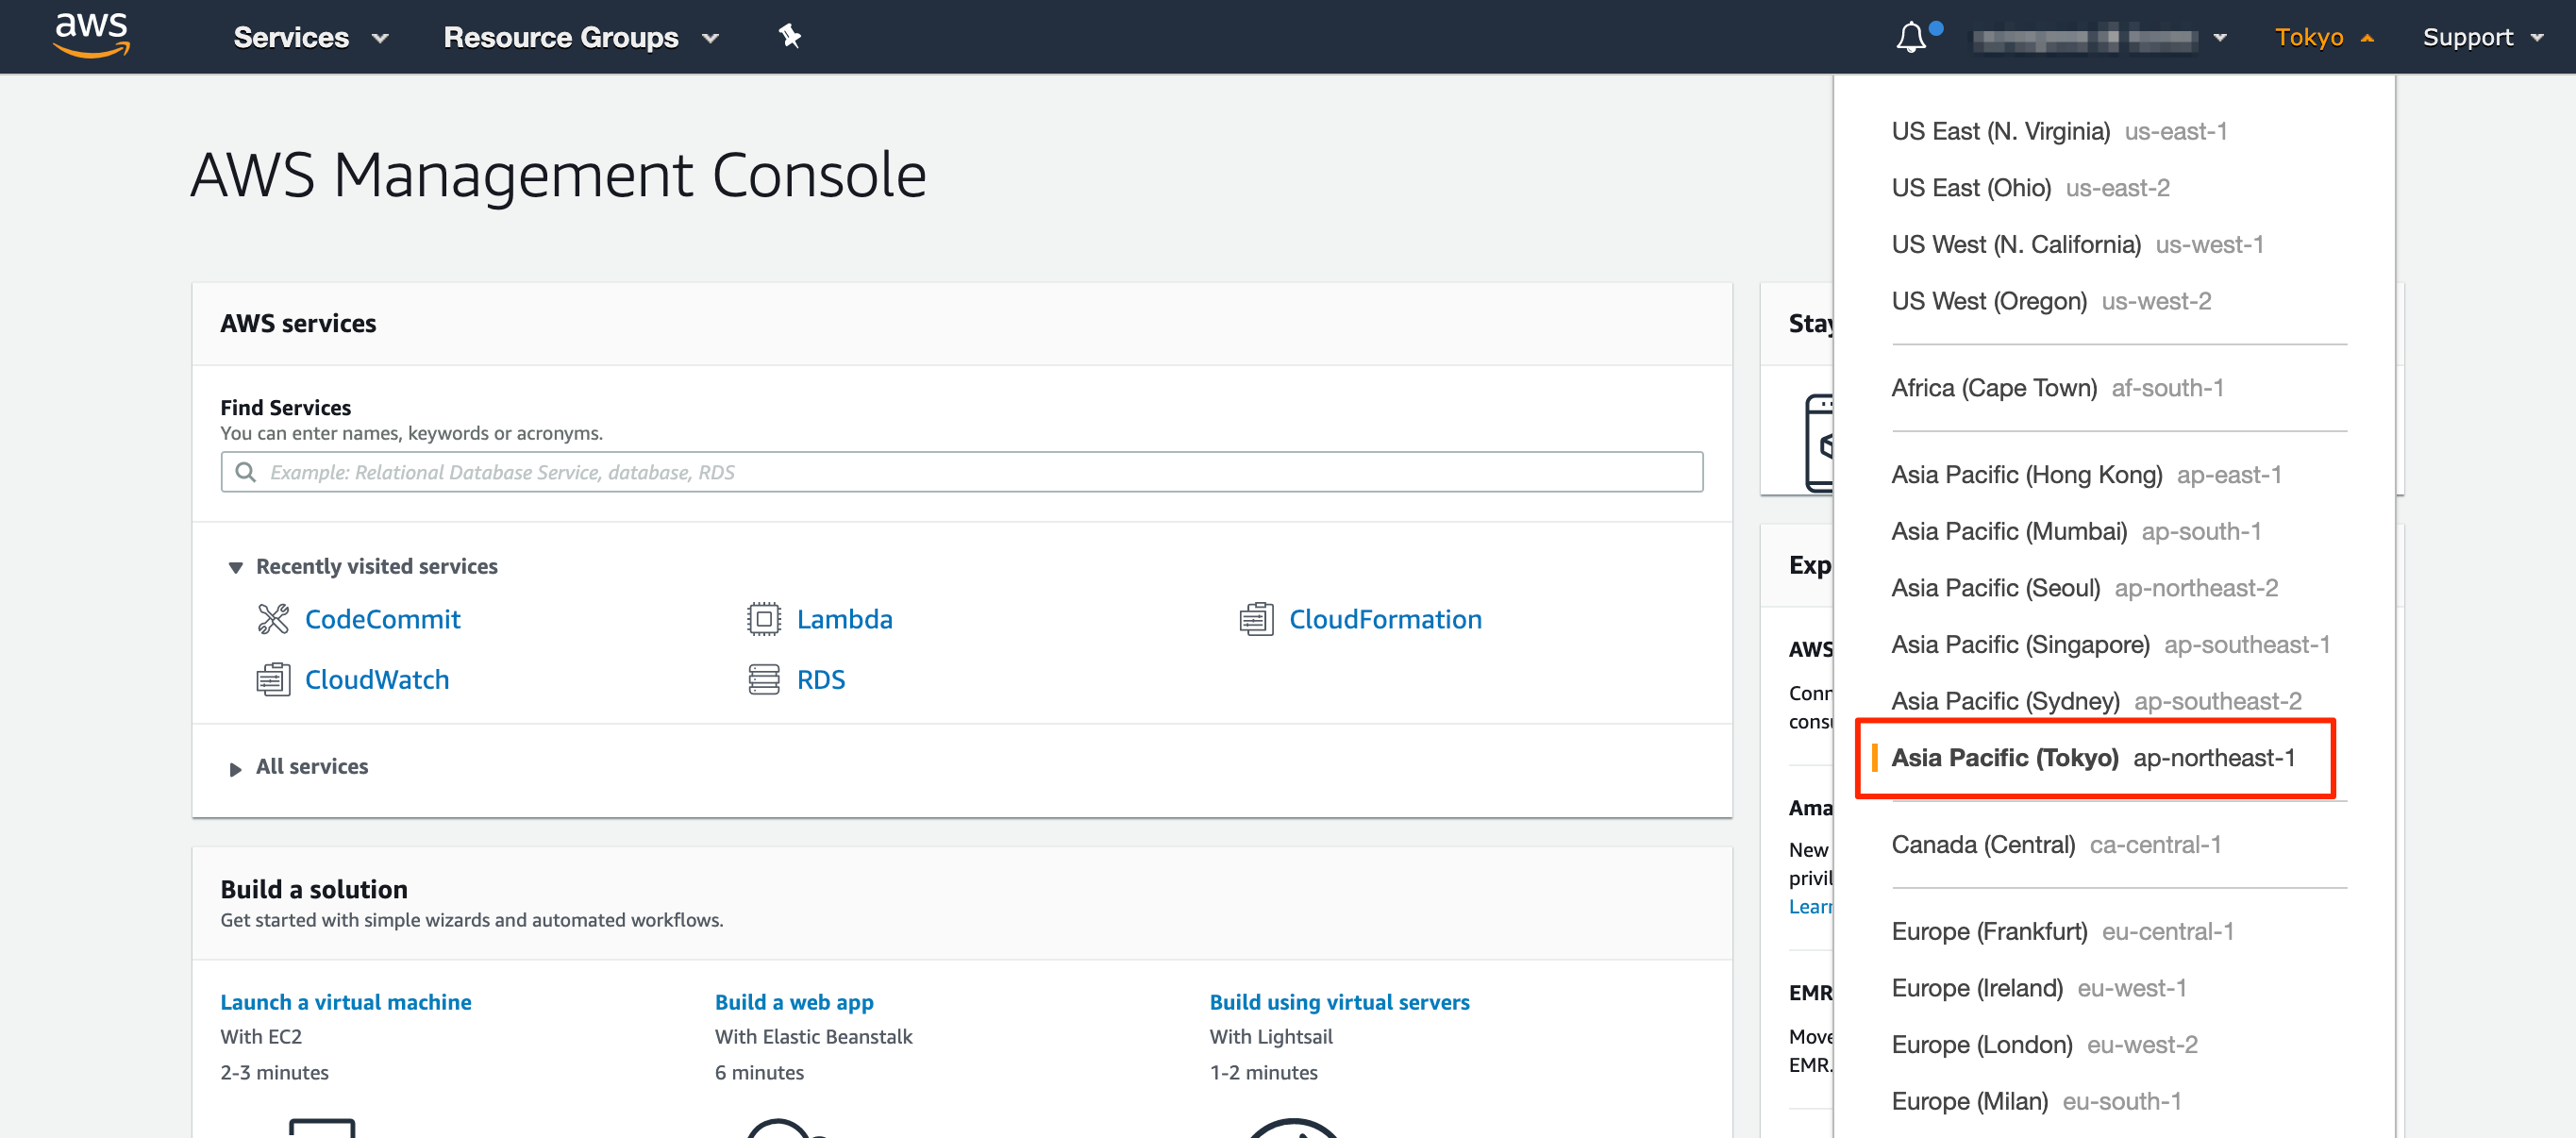
2. Check your AWS region.
- Select the region nearest to you unless you have a reason to choose another.
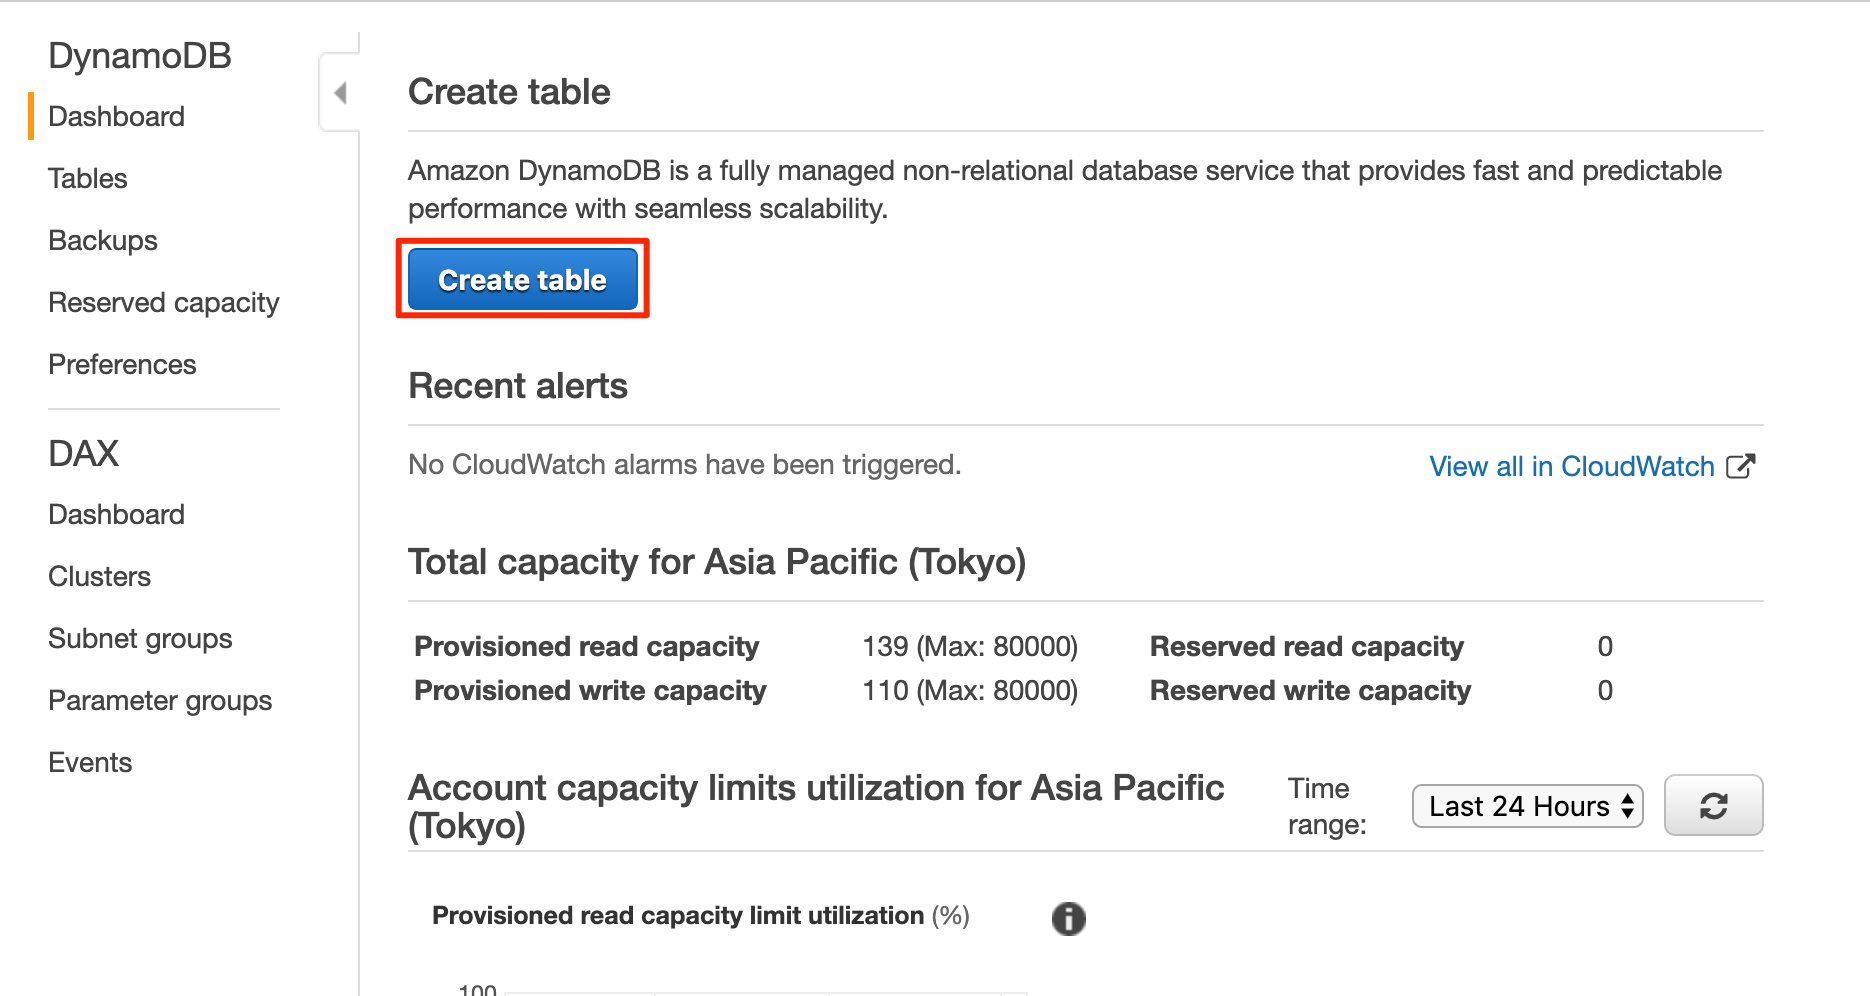
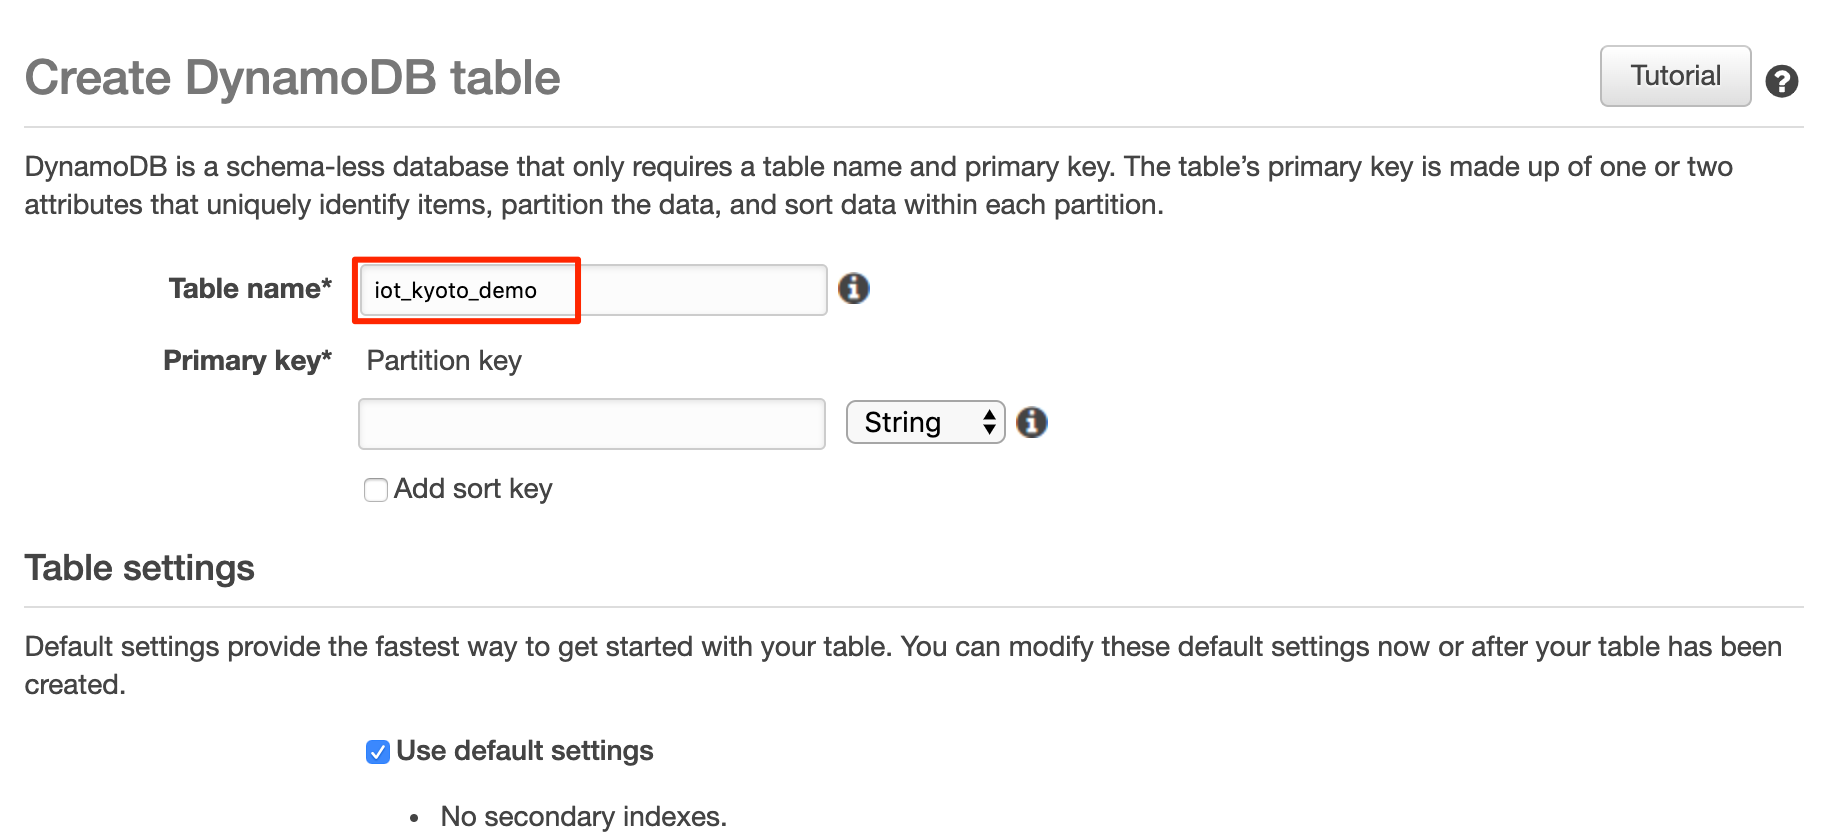
3. Press [Create table] in the DynamoDB console.
4. Enter any name in the table name field.
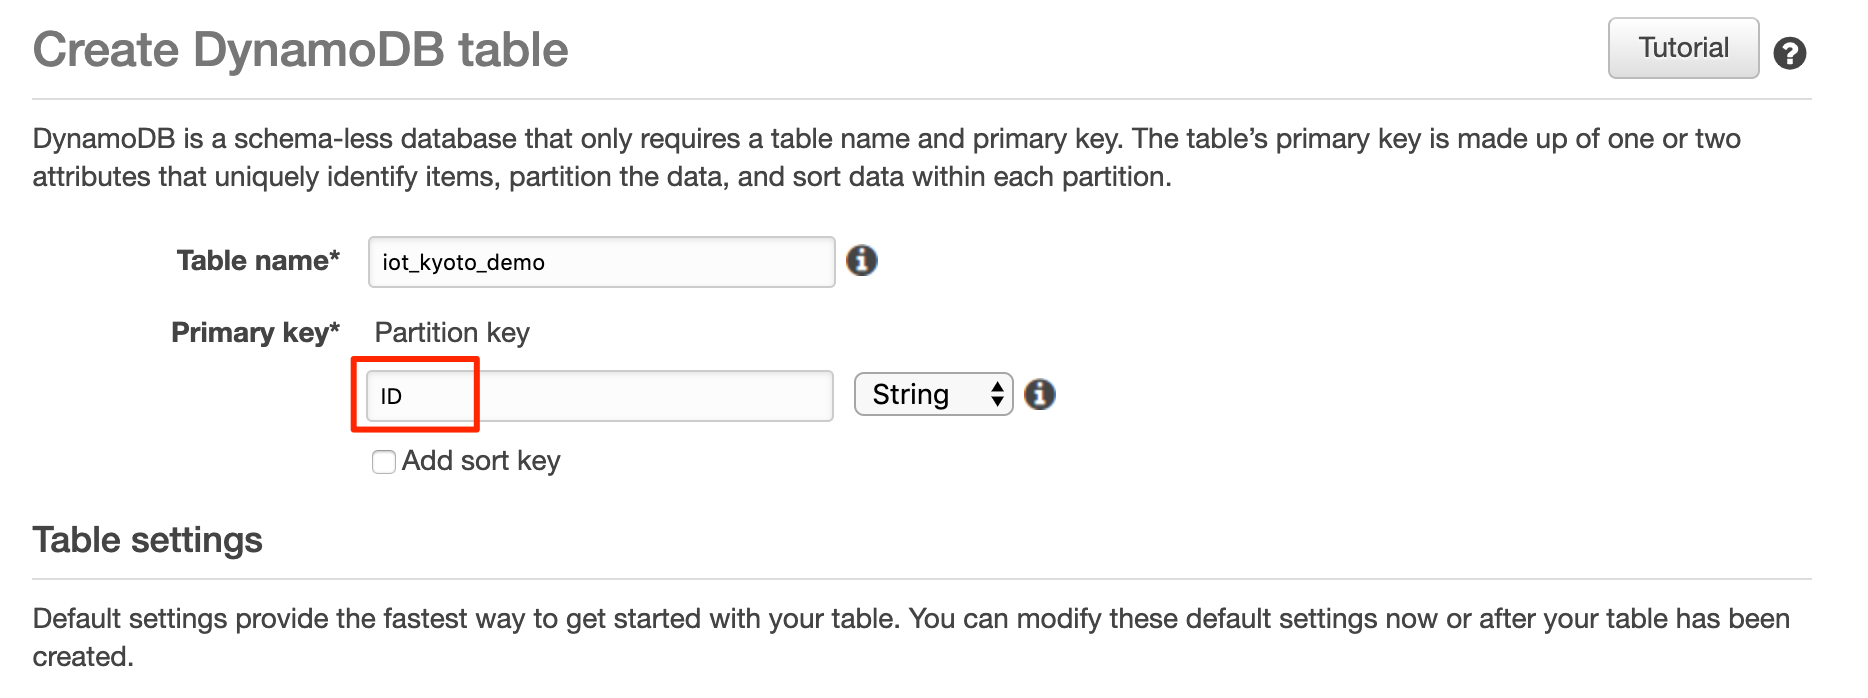
5. Enter any name for the partition key of the primary key.
- This key should contain a value that identifies an IoT device from which the data is transmitted.
- Enter the key name of which value is used to identify an IoT device.
- Select “String” or “Number” as its data type according to the output value format of your IoT device.
6. Check the [Add sort key] box.
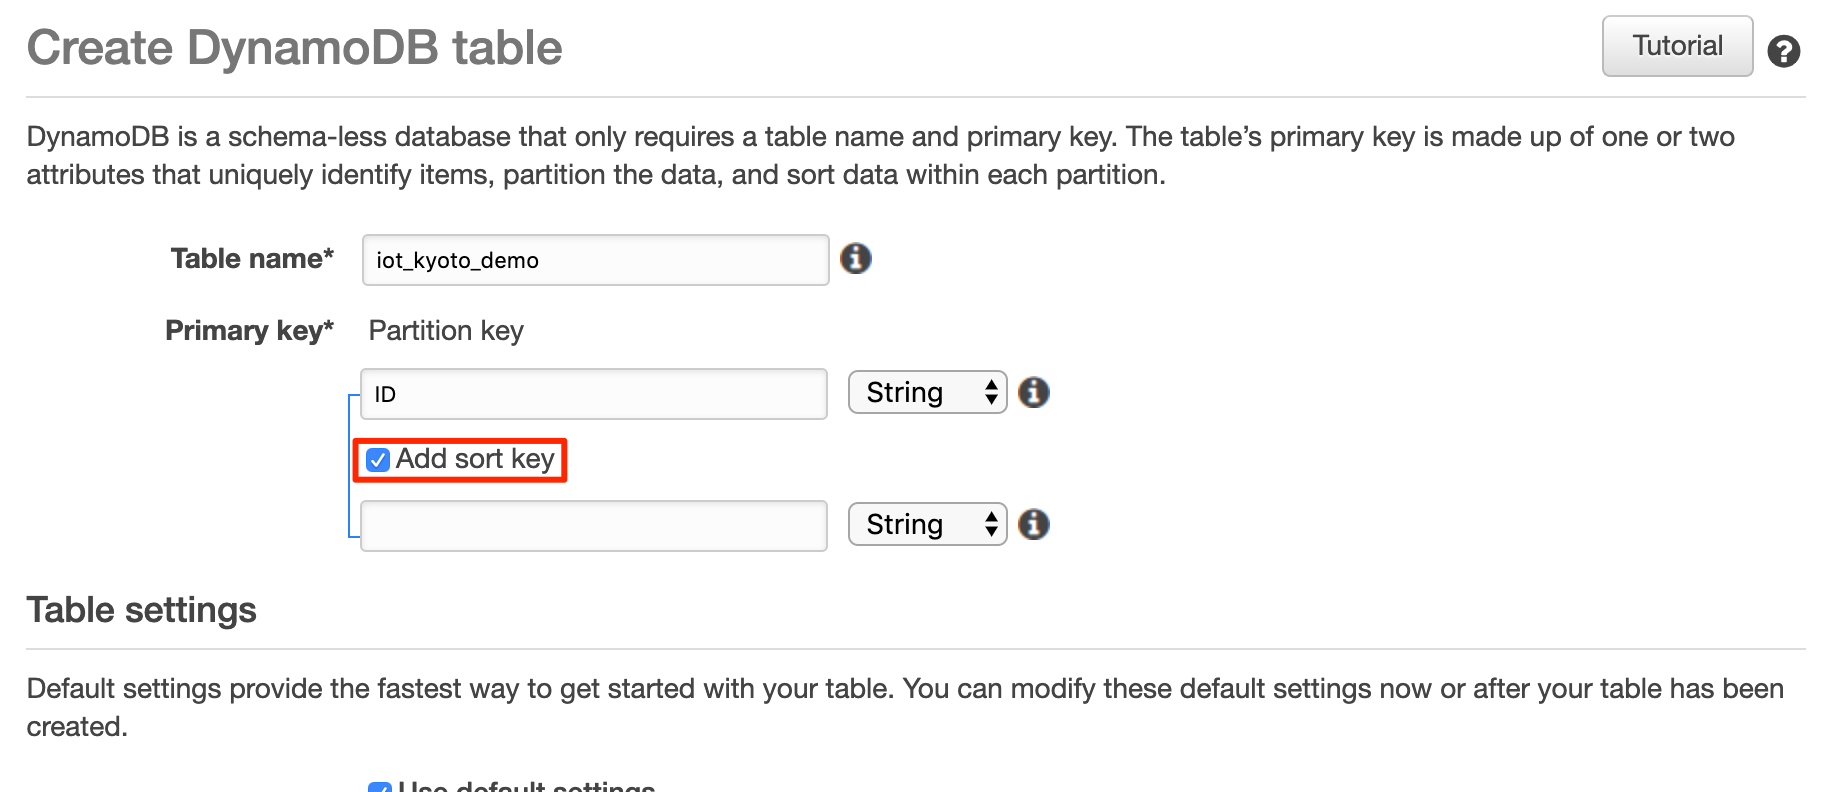
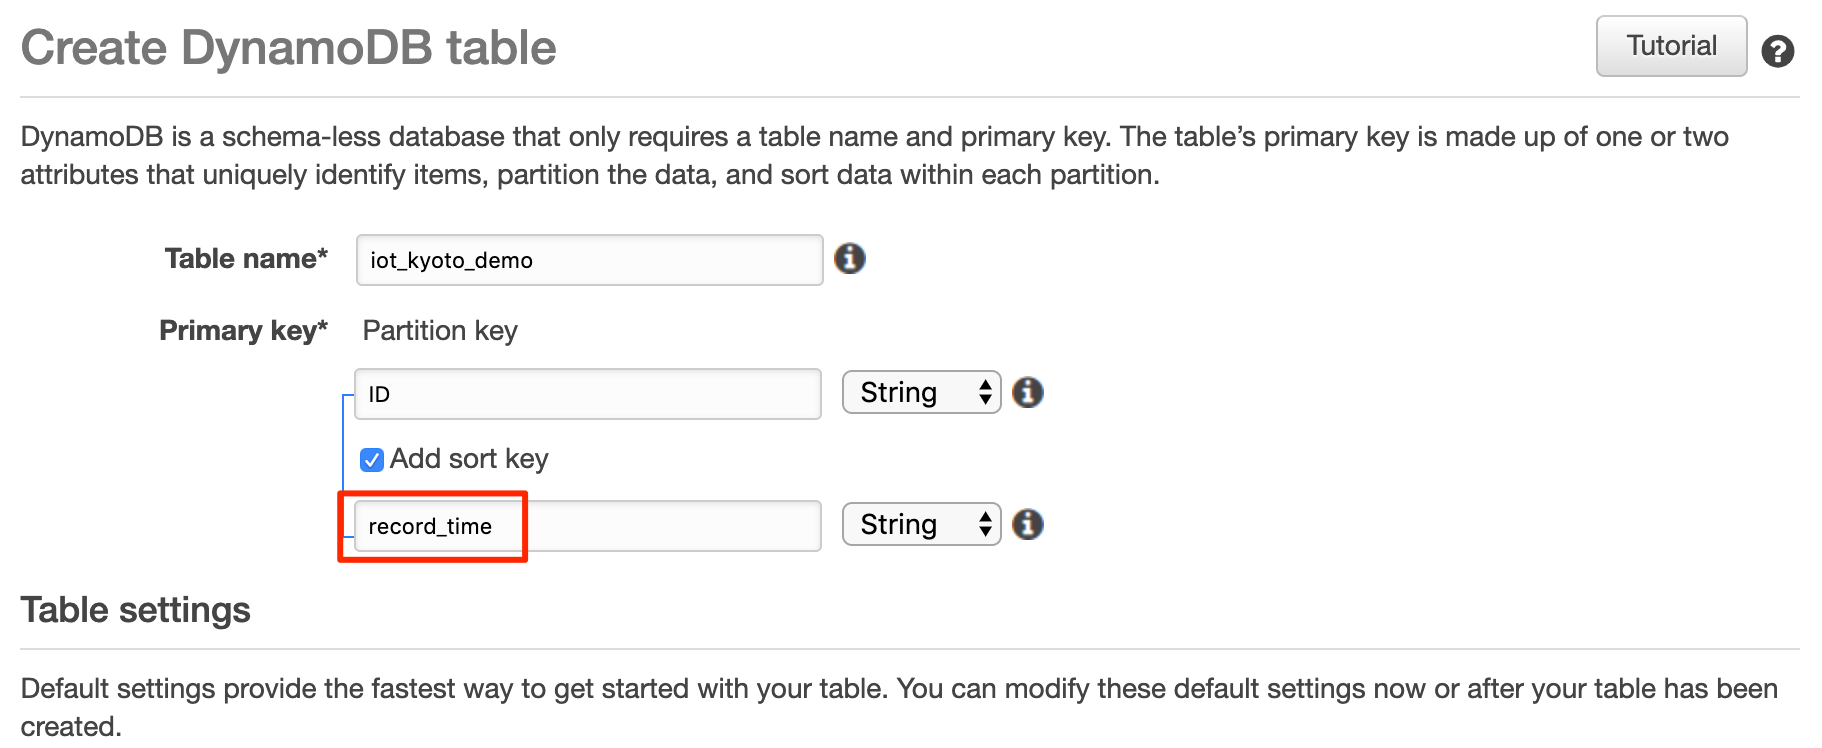
7. Enter any name for the sort key of the primary key.
- This key should contain time data such as data transmission time.
- Enter the key name that contains time data sent from your IoT device.
- Select “Character string” or “Numeric value” as its data type according to the output value format of your IoT device.
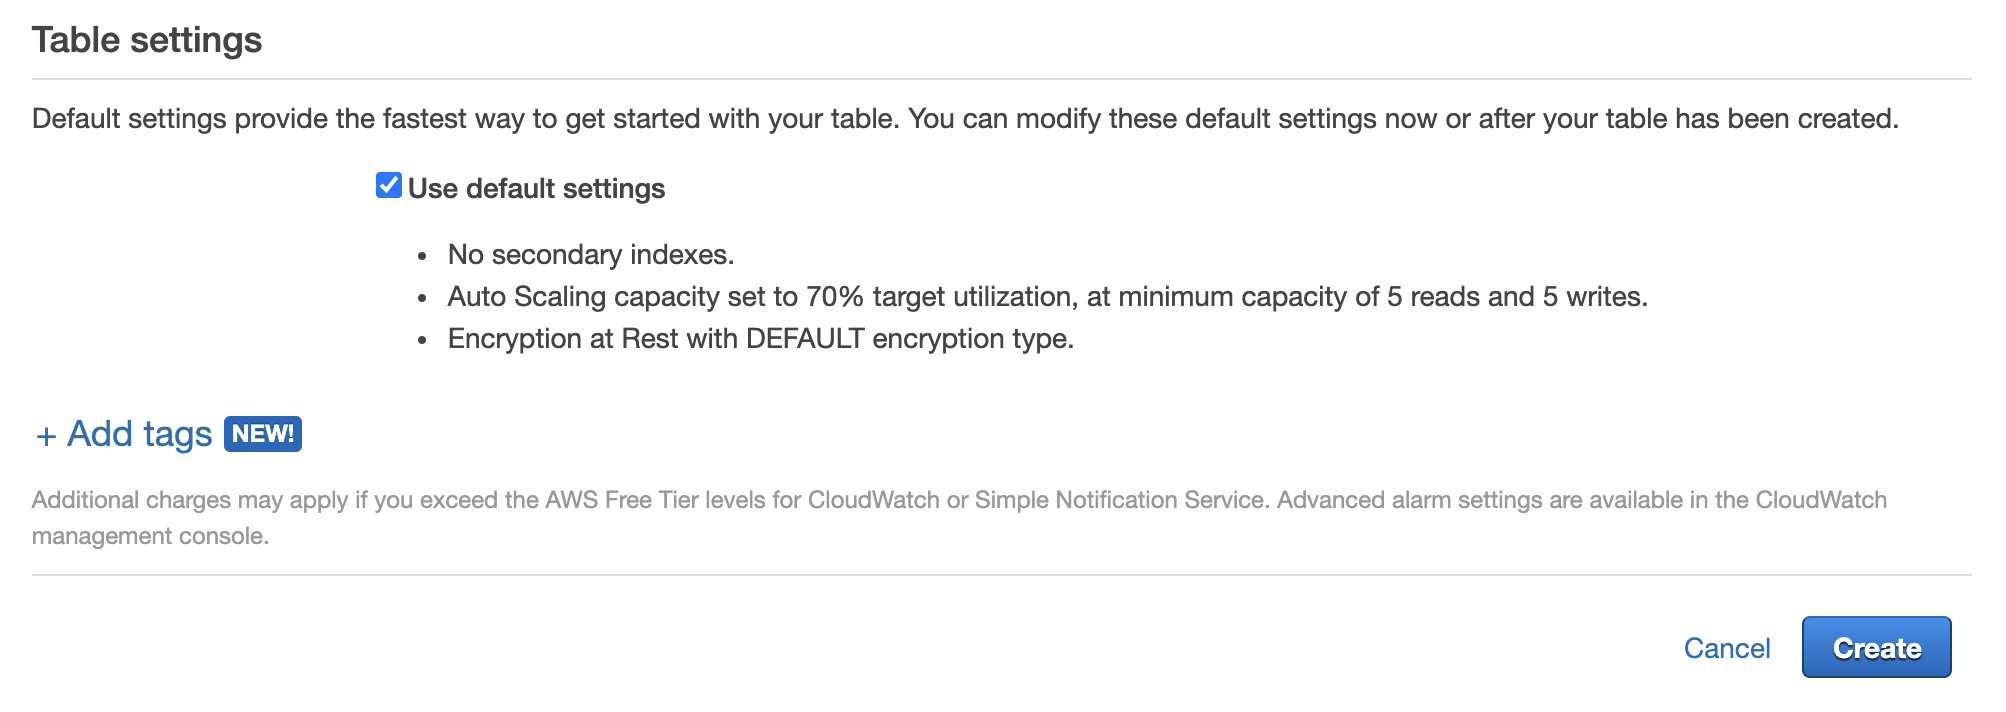
8. Make sure the box [Use default settings] is checked. Press [Create].
- The table will ne generated by pressing [Create].
[Step 2] Get IAM Access Key
Here we will be generating an access key that are granted access to table information of all DynamoDB tables and their data. If you want to narrow down the permission, please refer to the procedure here.
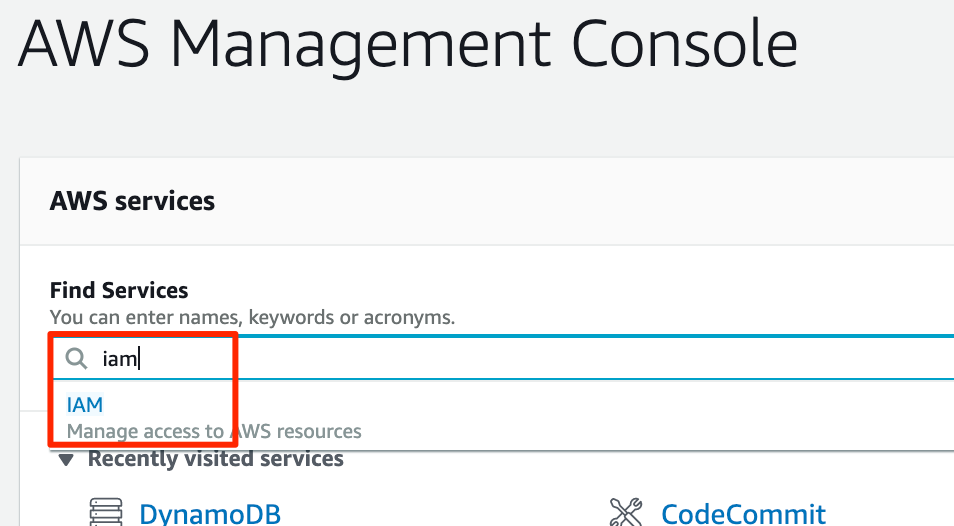
1. Open the Identity and Access Management (IAM) console.
- Enter “IAM” in the “Find Services” field of the AWS Management Console and select “IAM”.
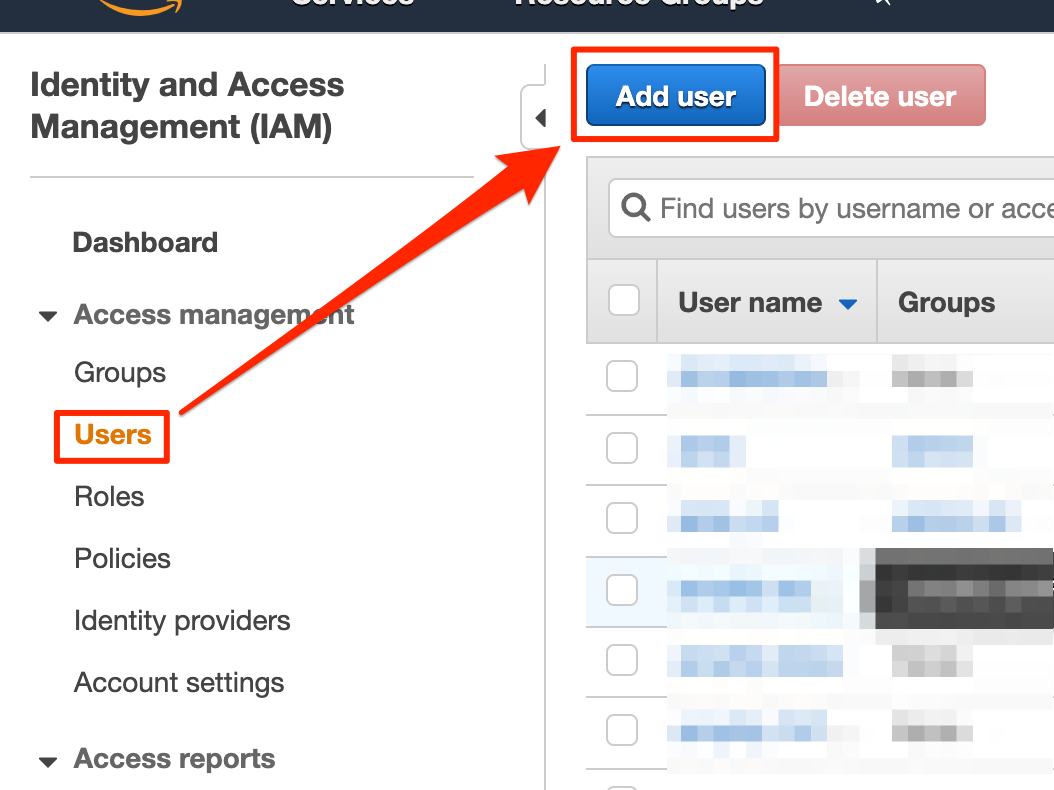
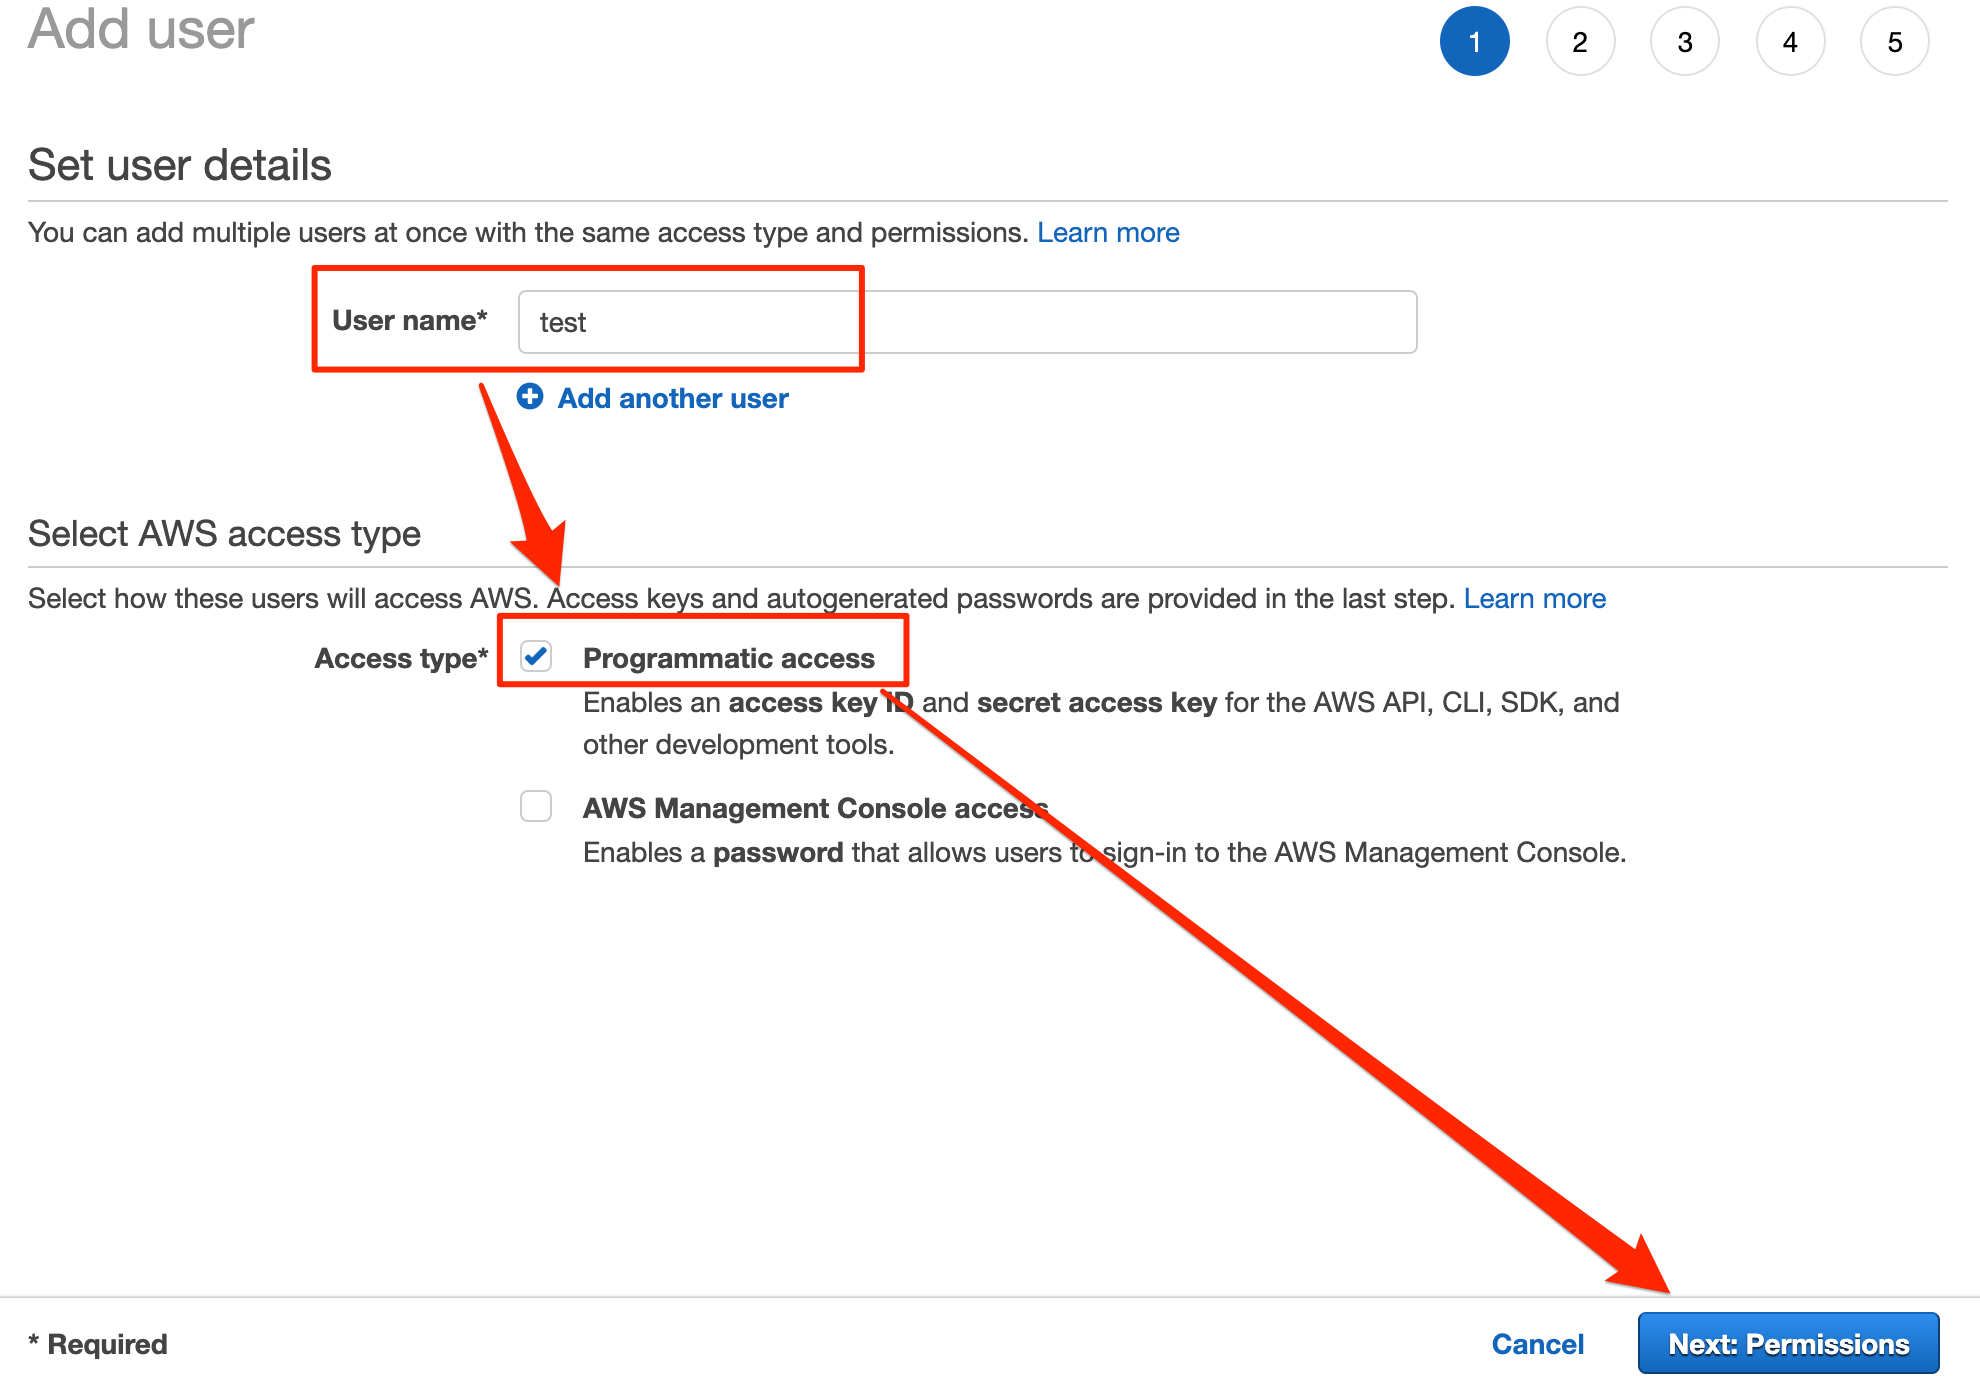
2. Select [Users] to open it. Press [Add user] to create a user with any name.
- Check the box of [Programmatic access].
- Press [Next: Permissions].
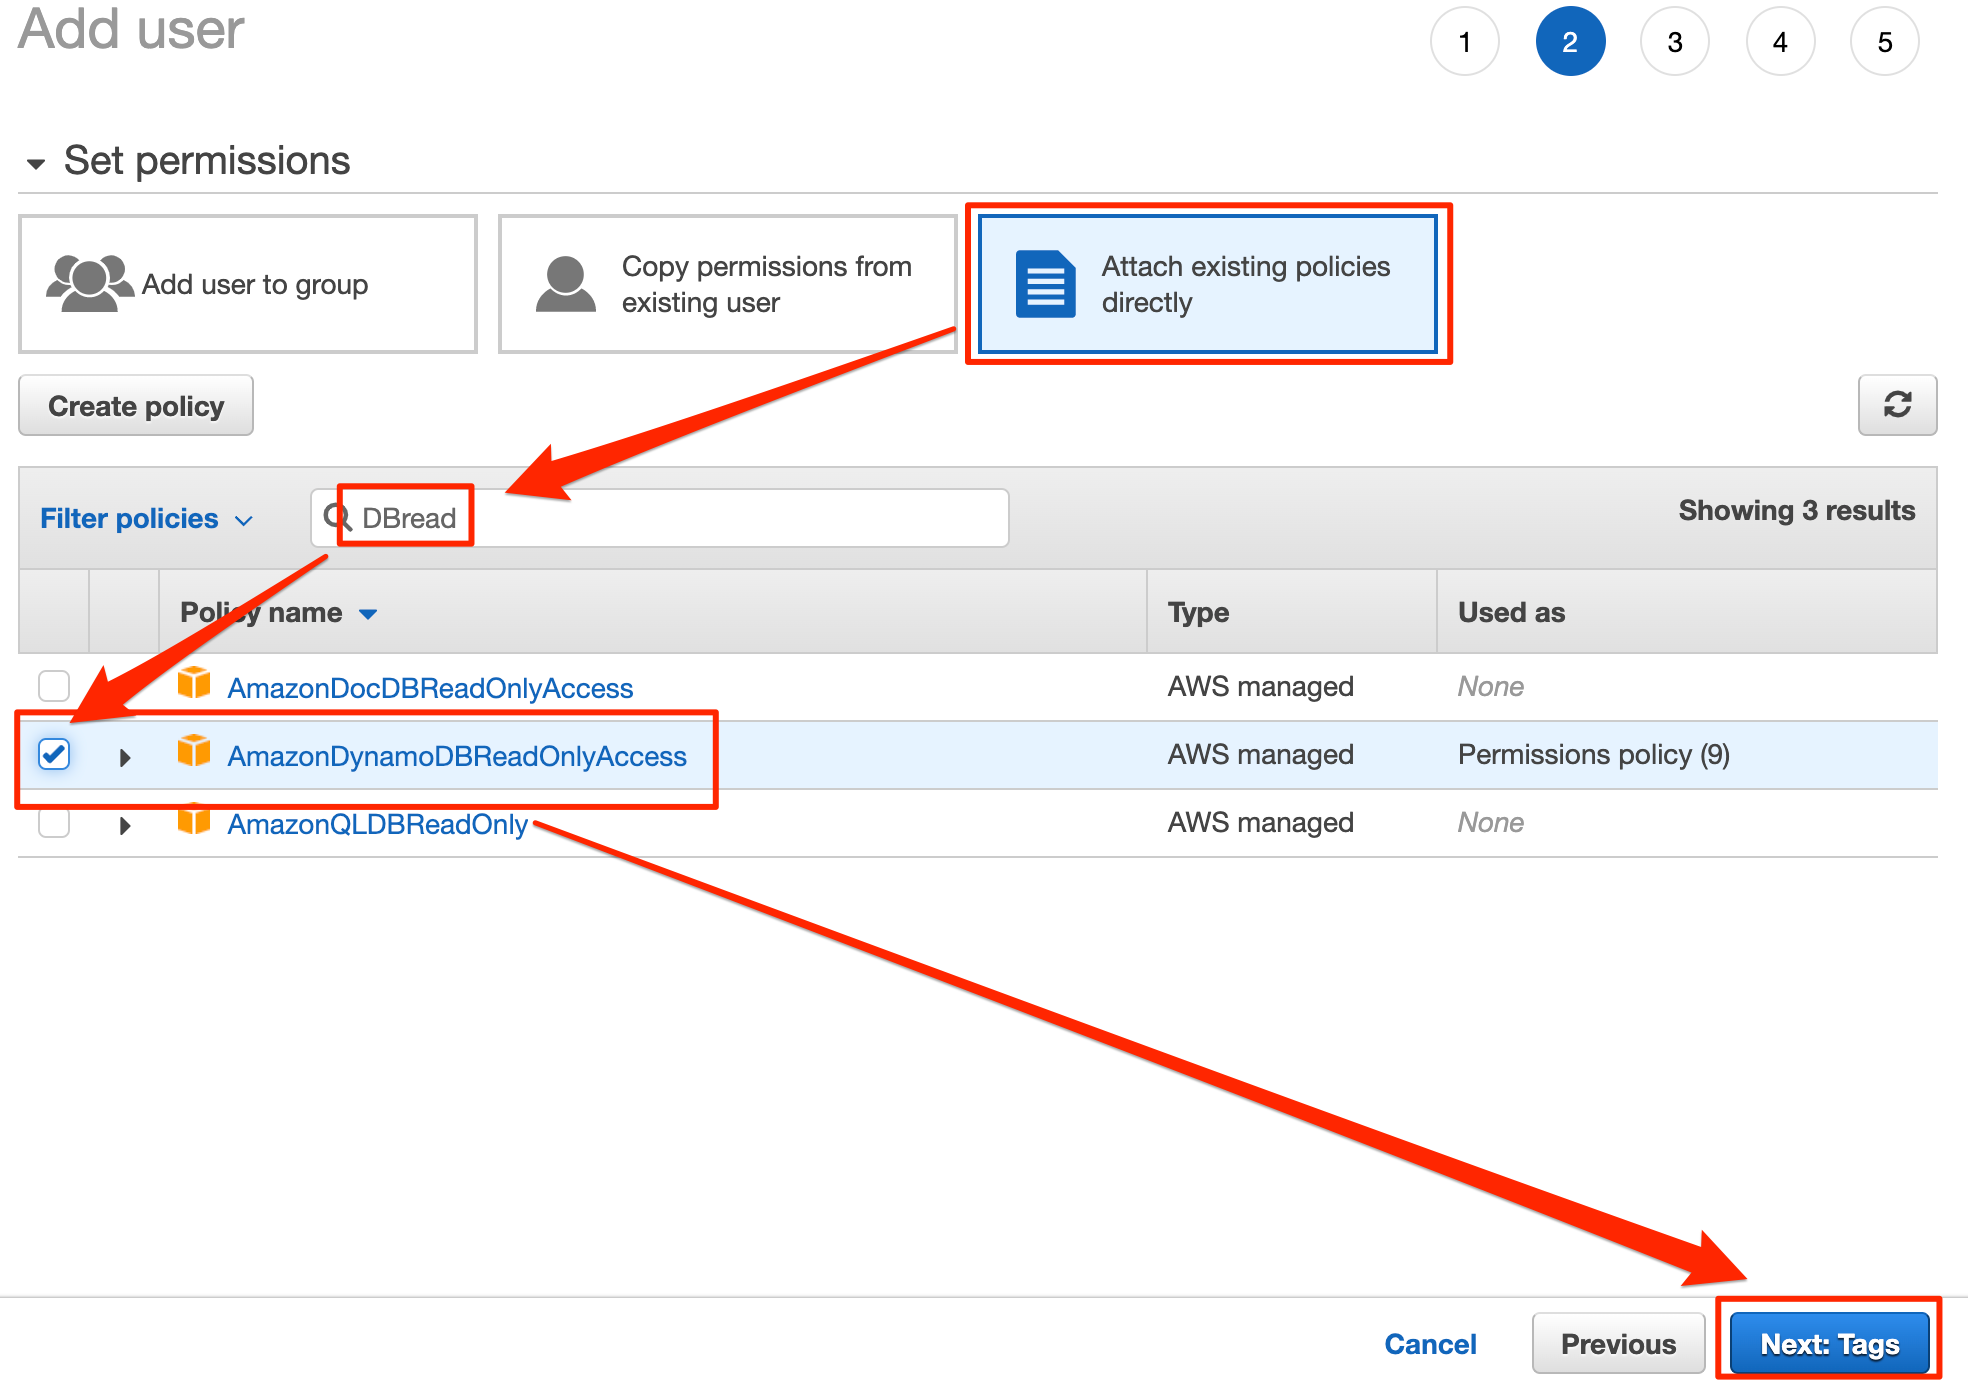
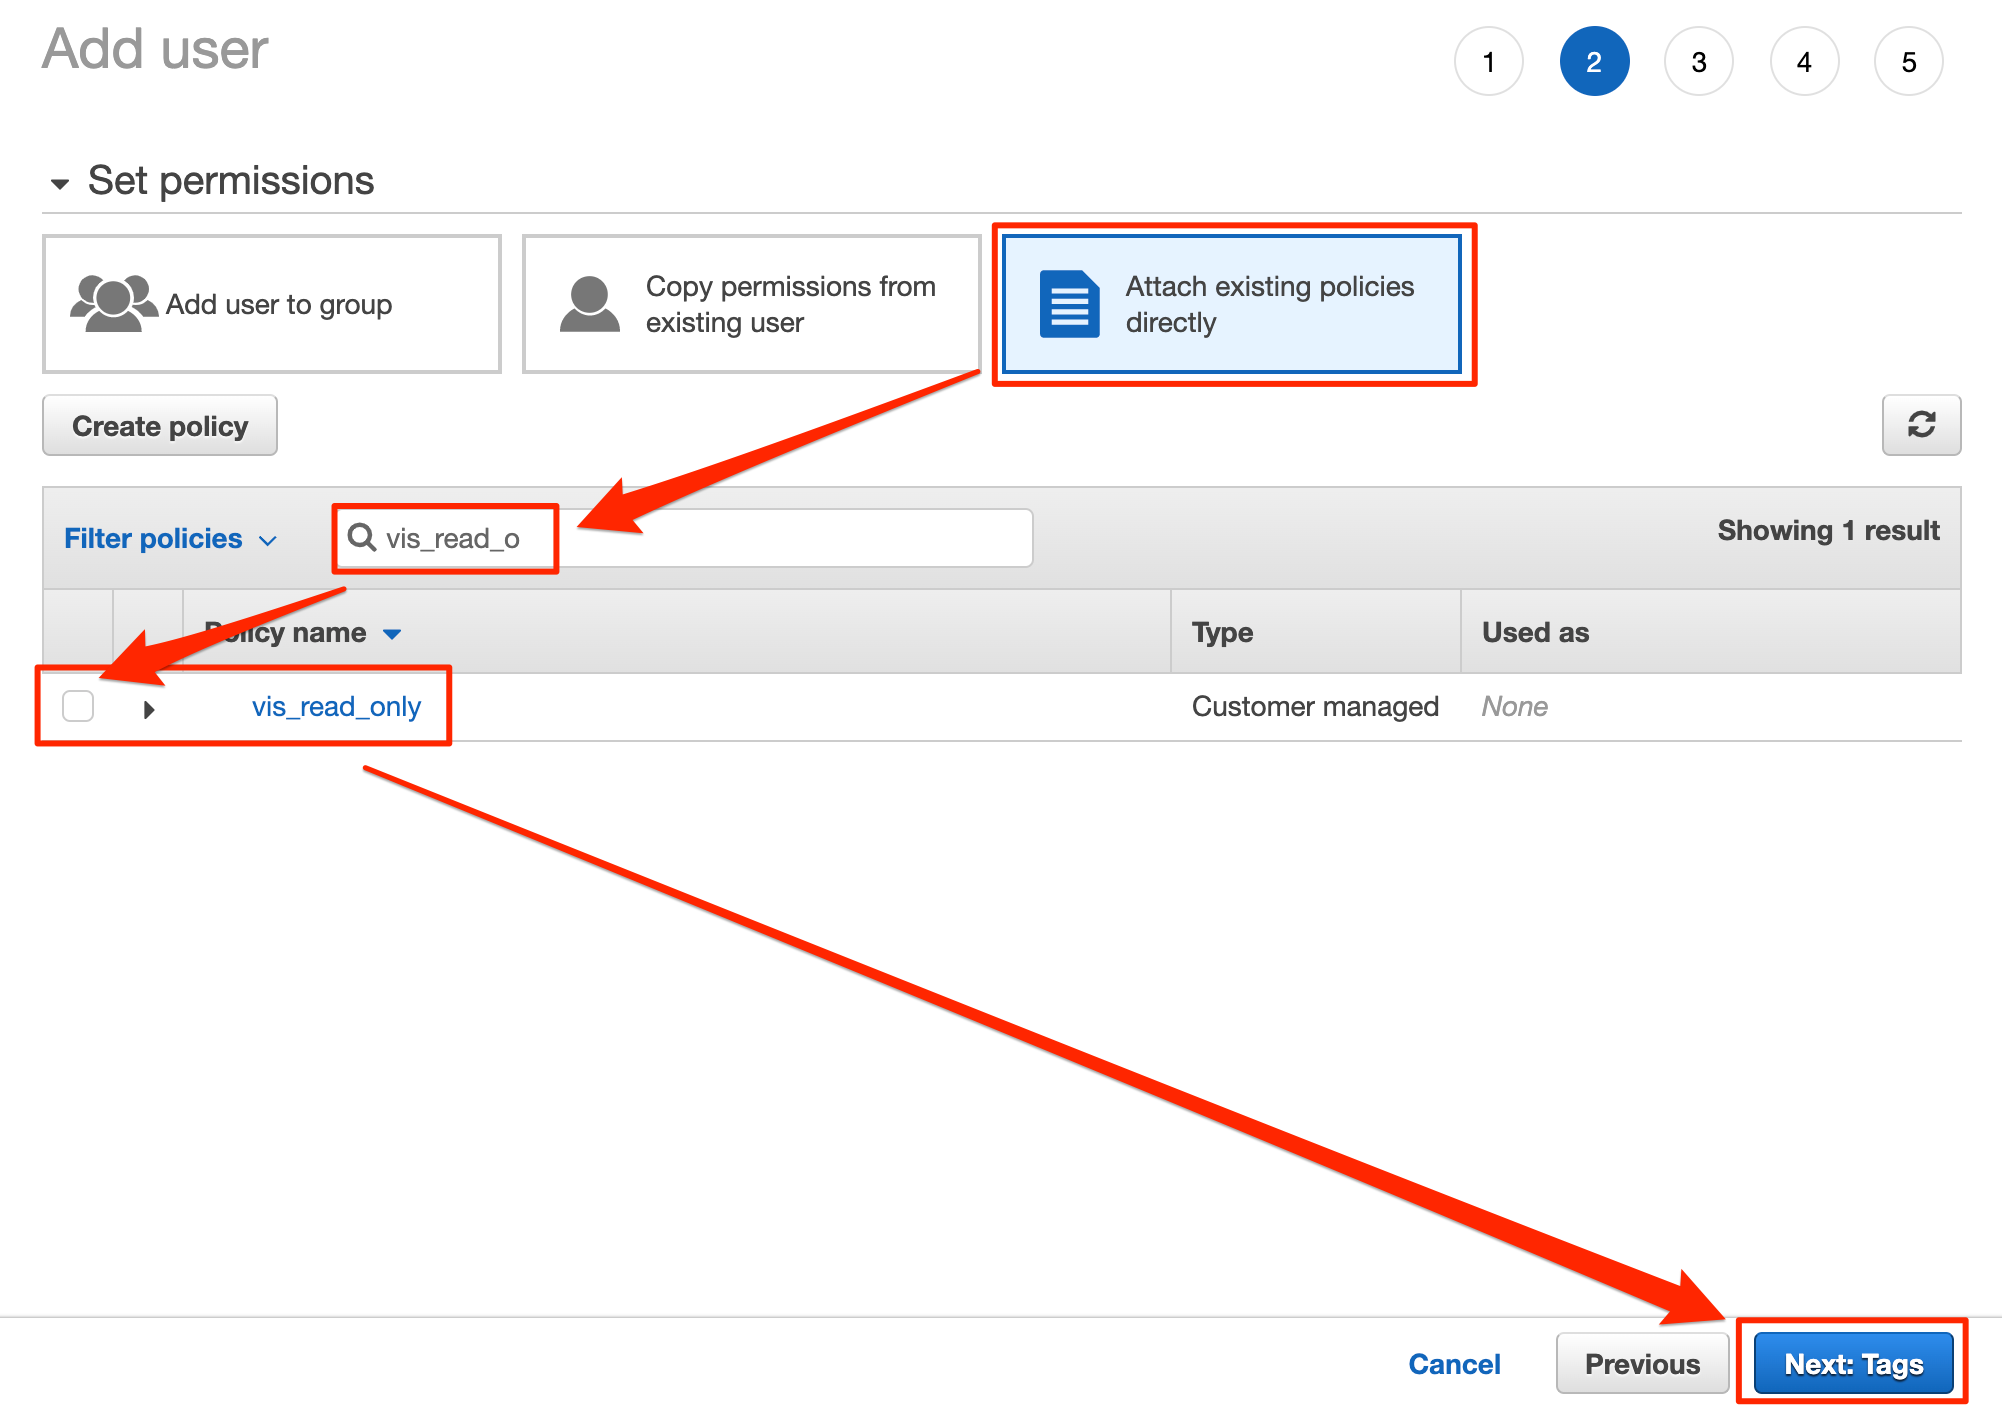
3. Set access authority.
- Select [Attach existing policies directly].
- Check the [AmazonDynamoDBReadOnlyAccess] policy and press [Next Step].
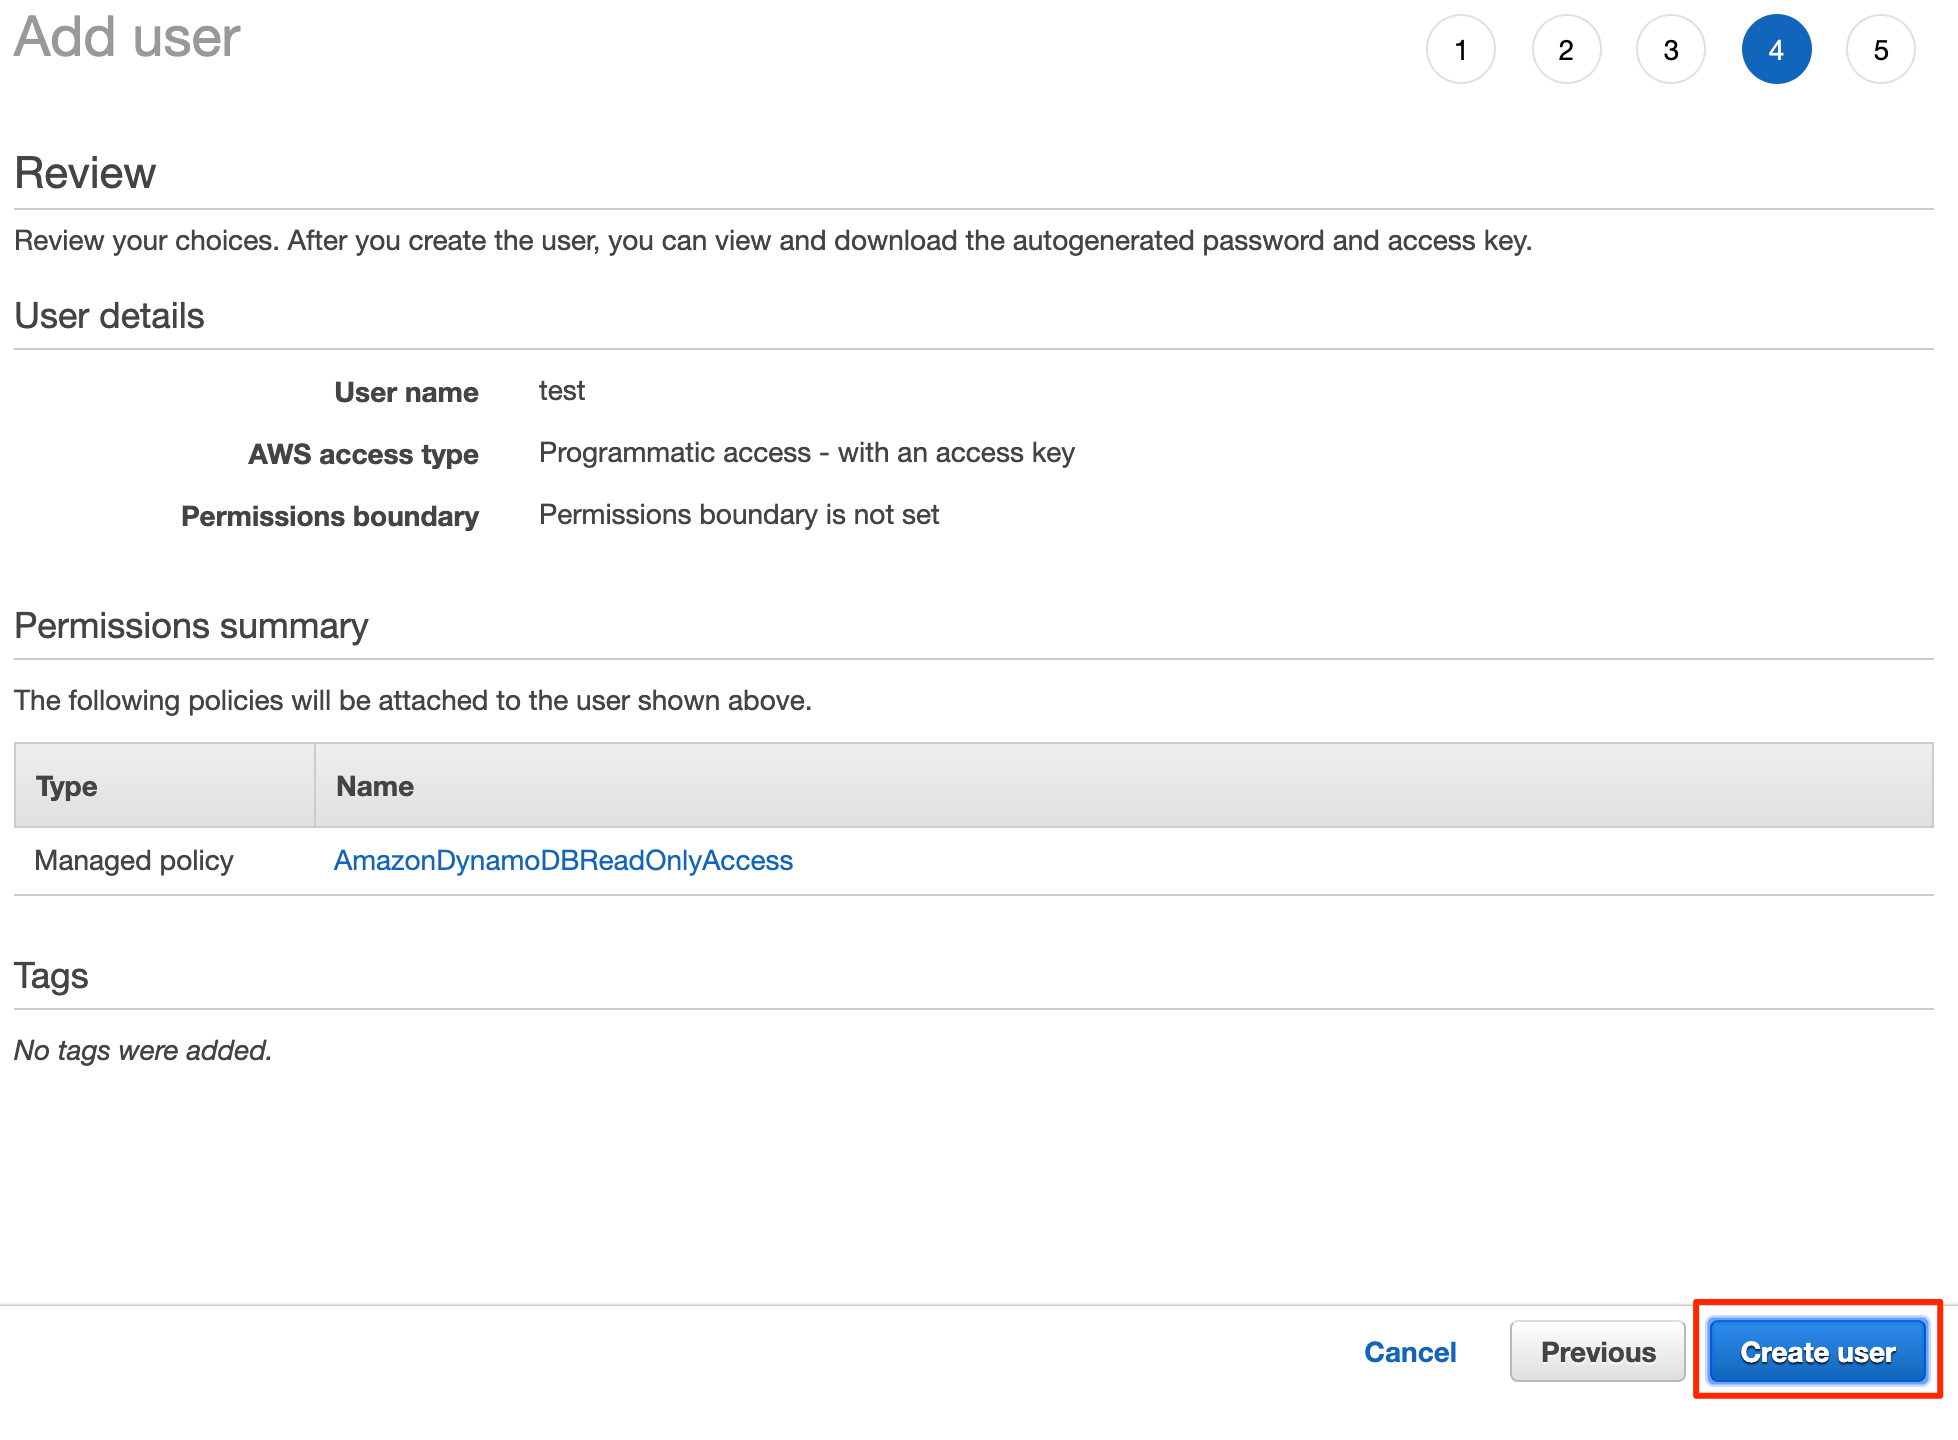
4. Enter [Add Tag] as desired and press [Next: Review].
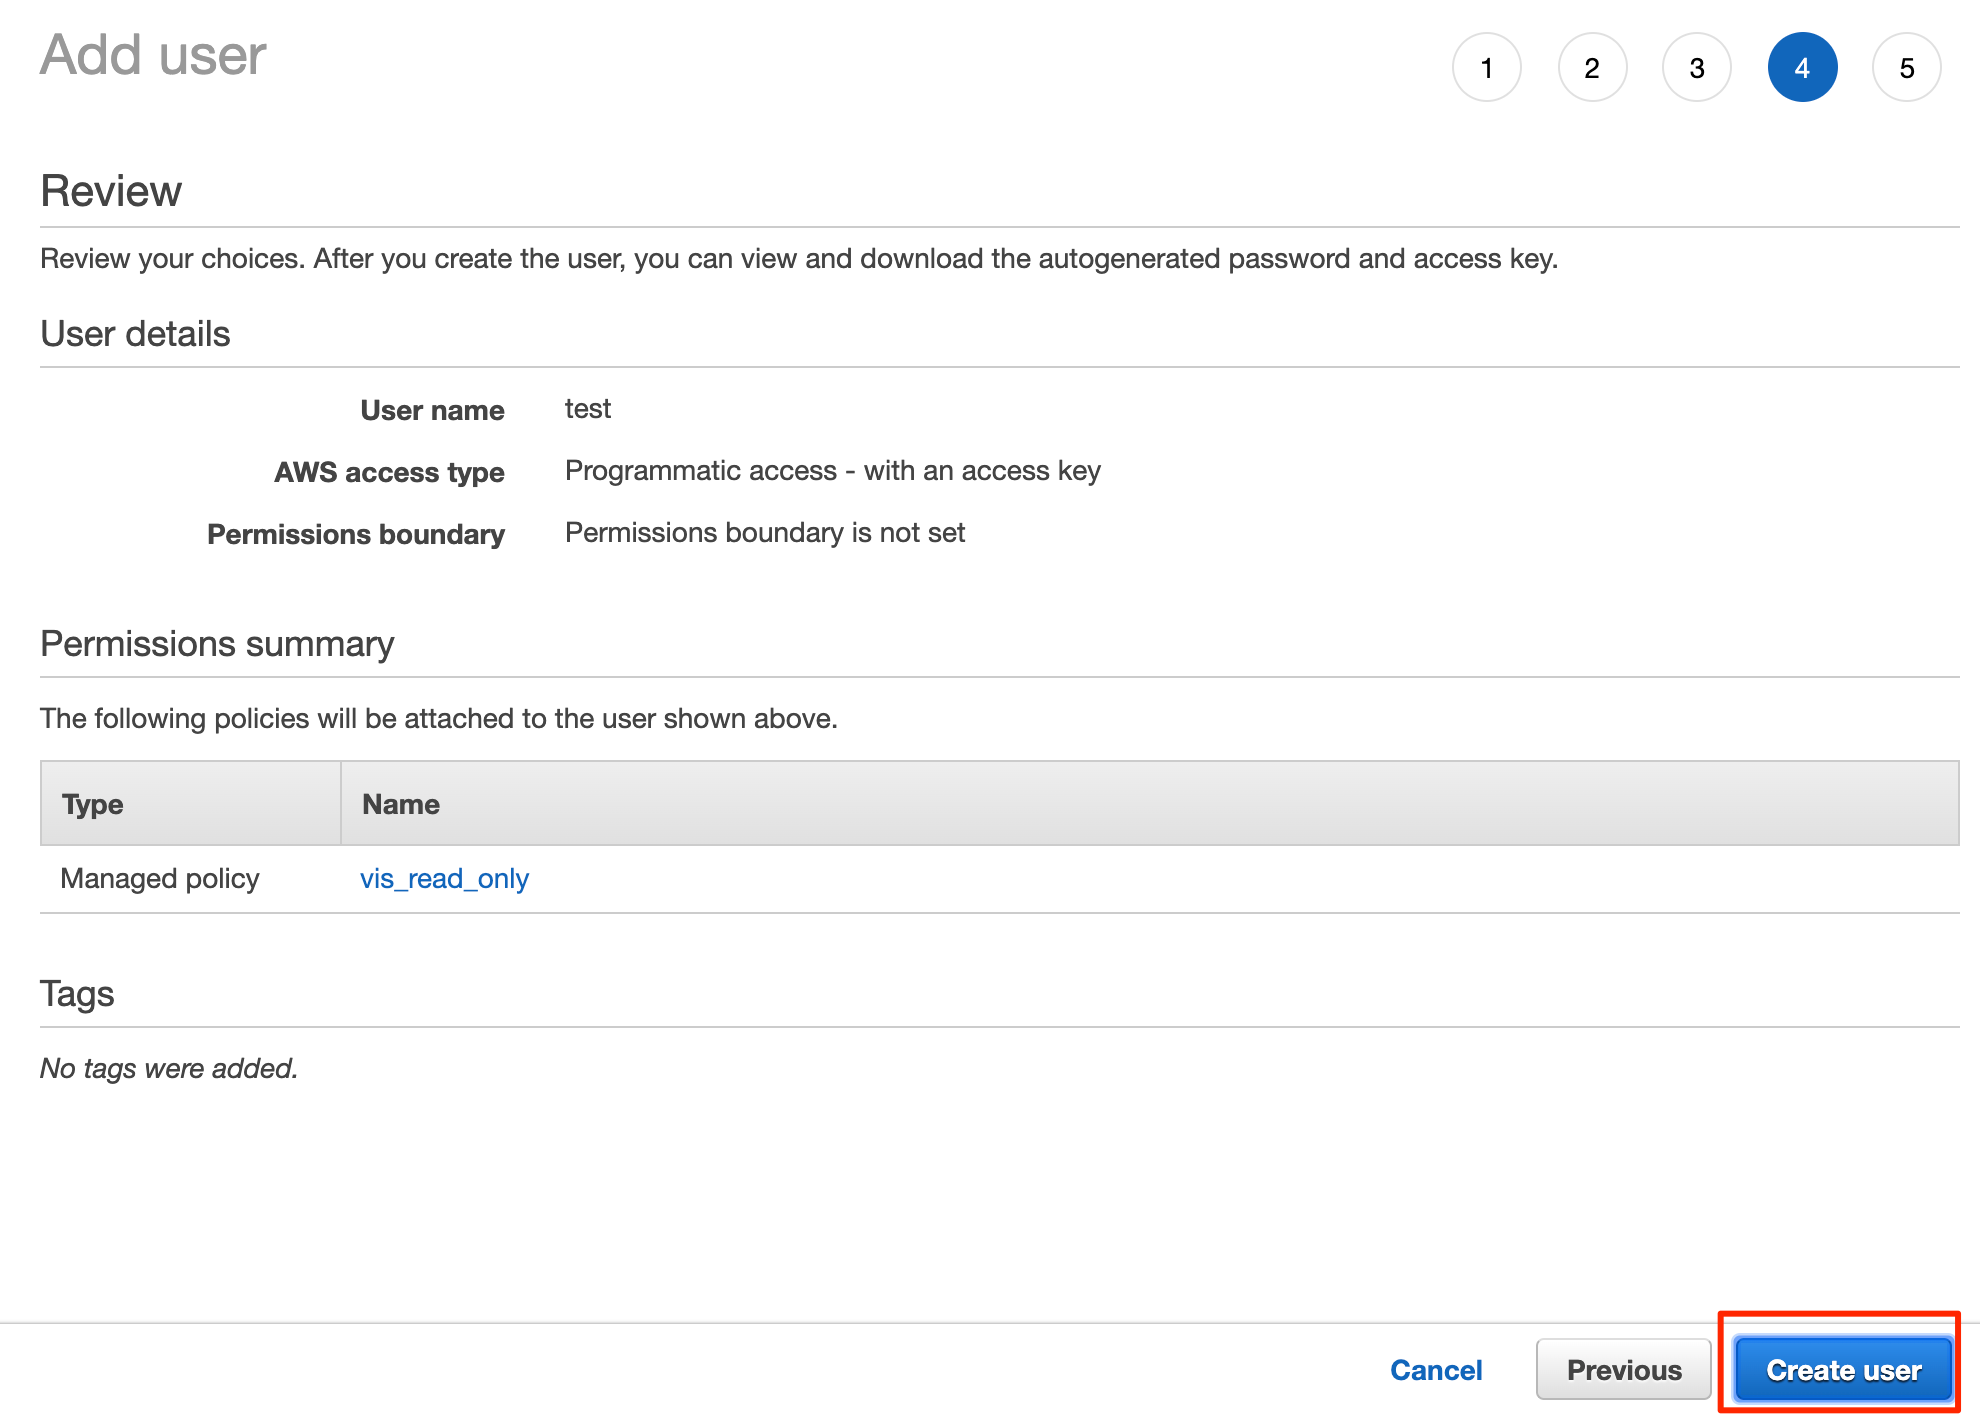
5. If there is no probrem with the content, press [Create user].
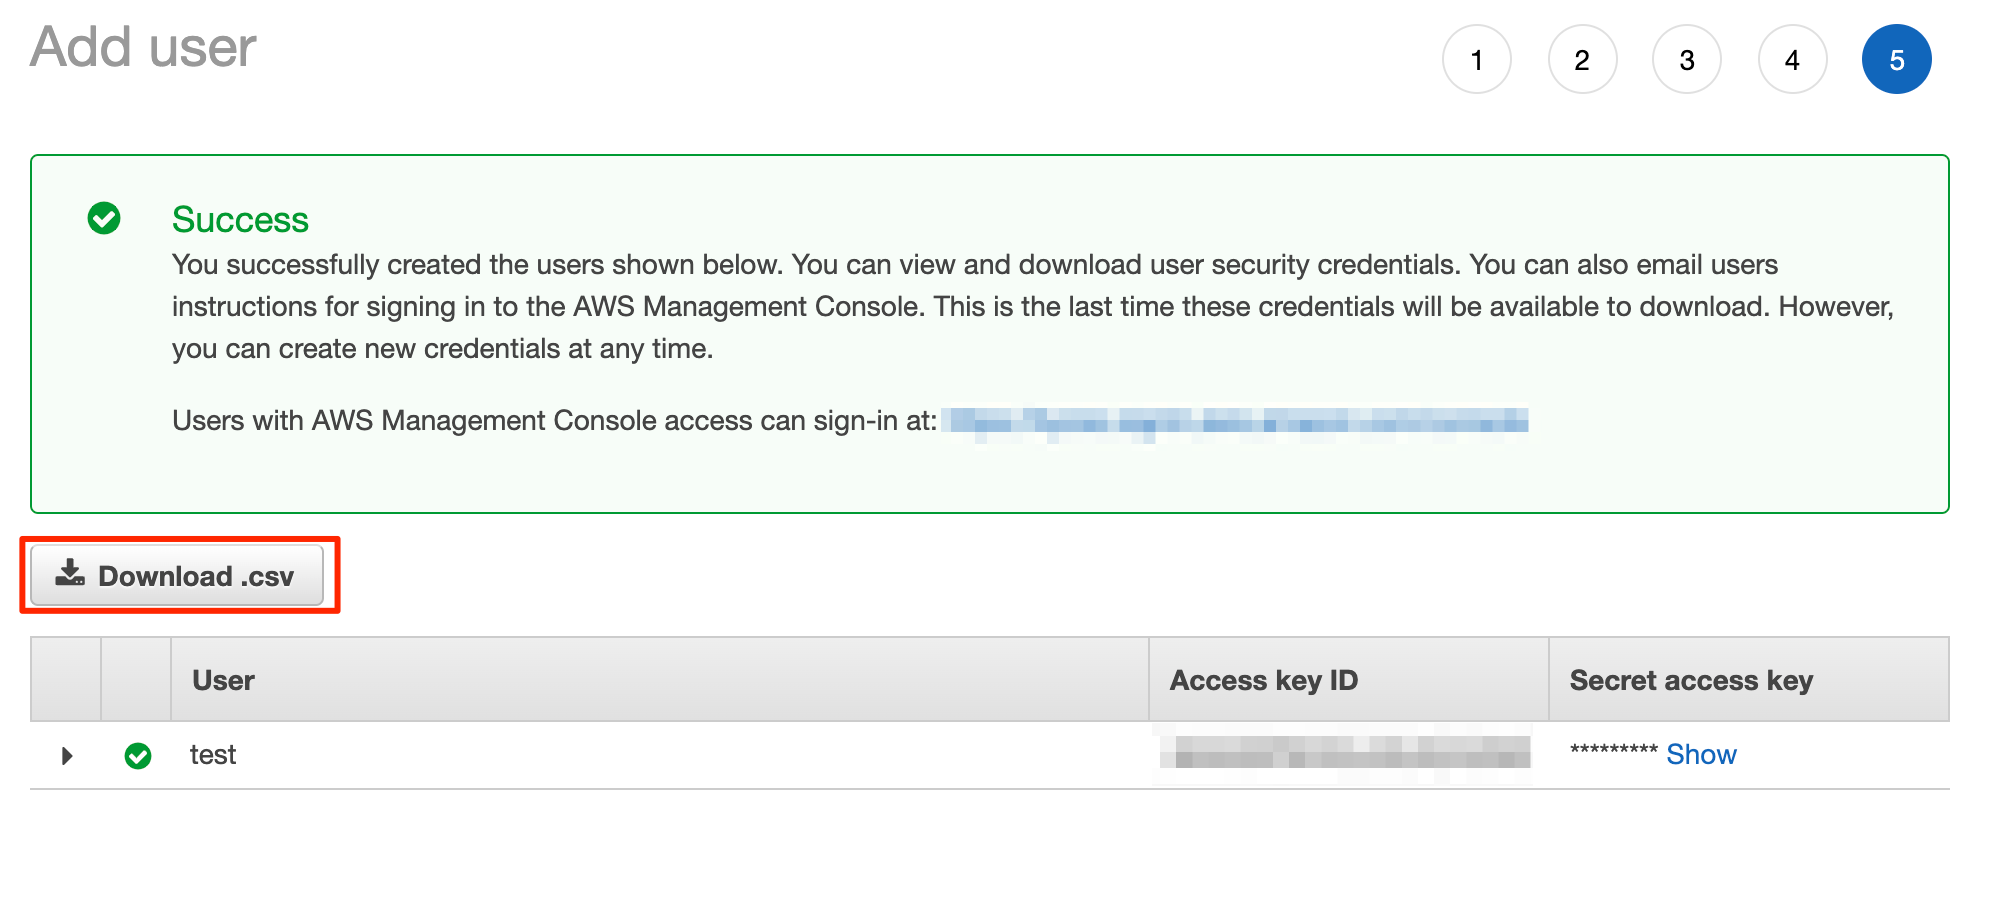
-
After creating the account, a CSV file that contains the user’s authentication information will be generated; press [Download .csv] and download the file.
Note: if you forget to download the CSV file, you may have to recreate the authentication information, so be sure to download it.
How to create an Access Key with limited privileges
If you have already generated the access key, proceed to Step 3.
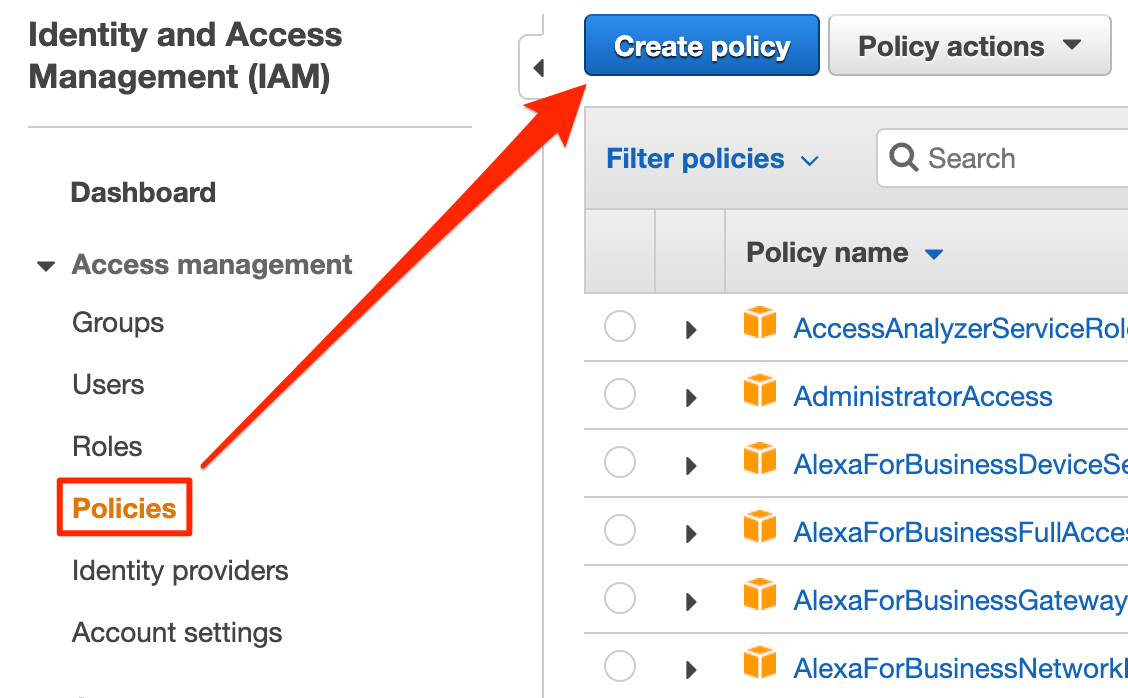
1. Open the Identity and Access Management (IAM) console.
- Enter “IAM” in the “Find Services” field of the AWS Management Console and select “IAM”.
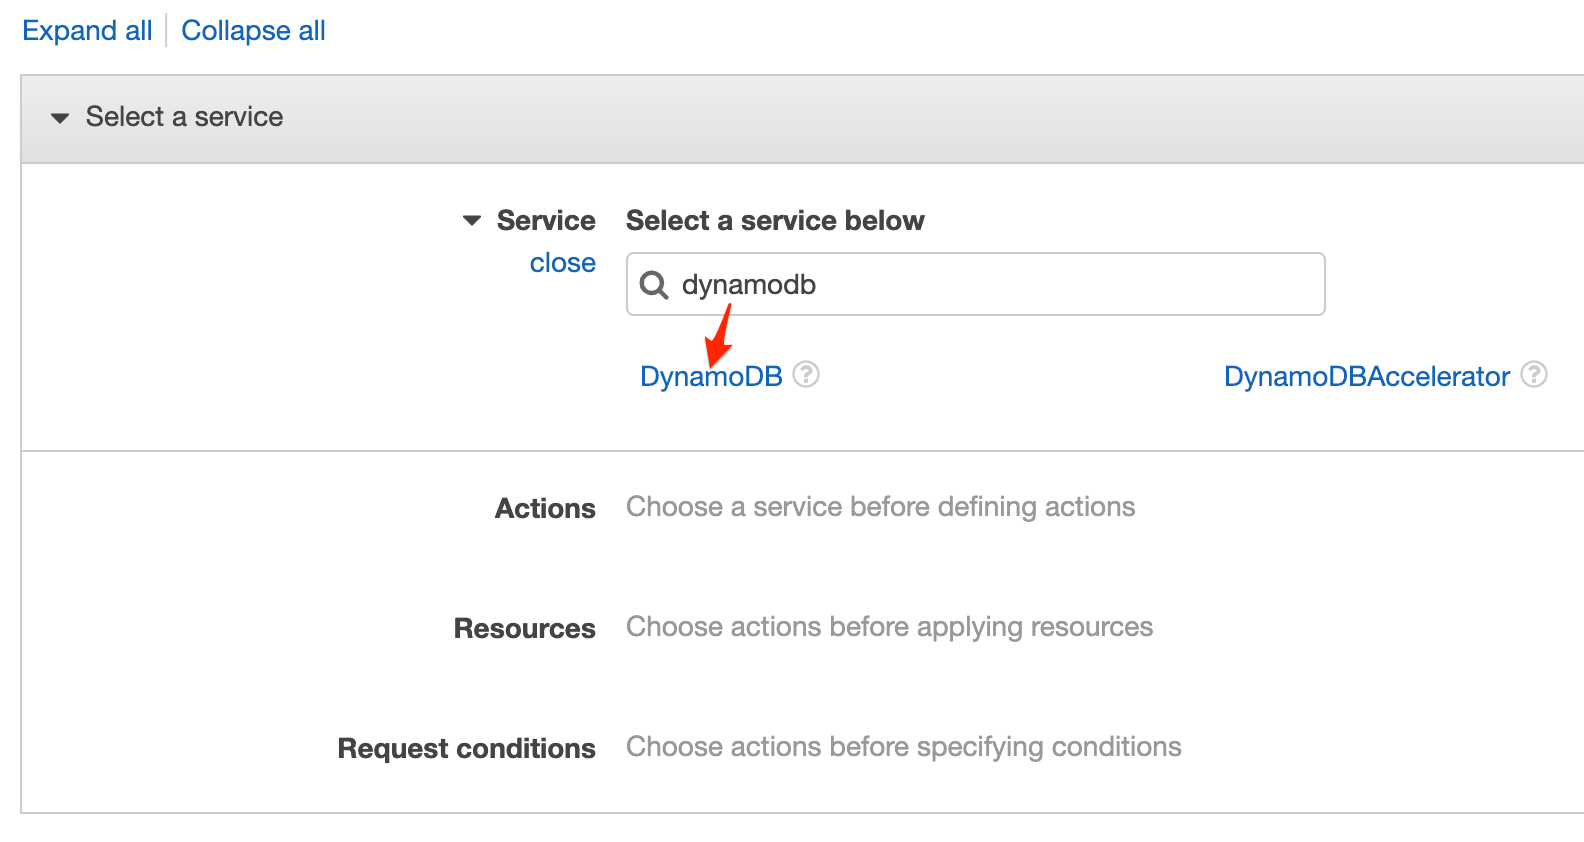
2. Select “Policies” to open it. Press [Create policy].
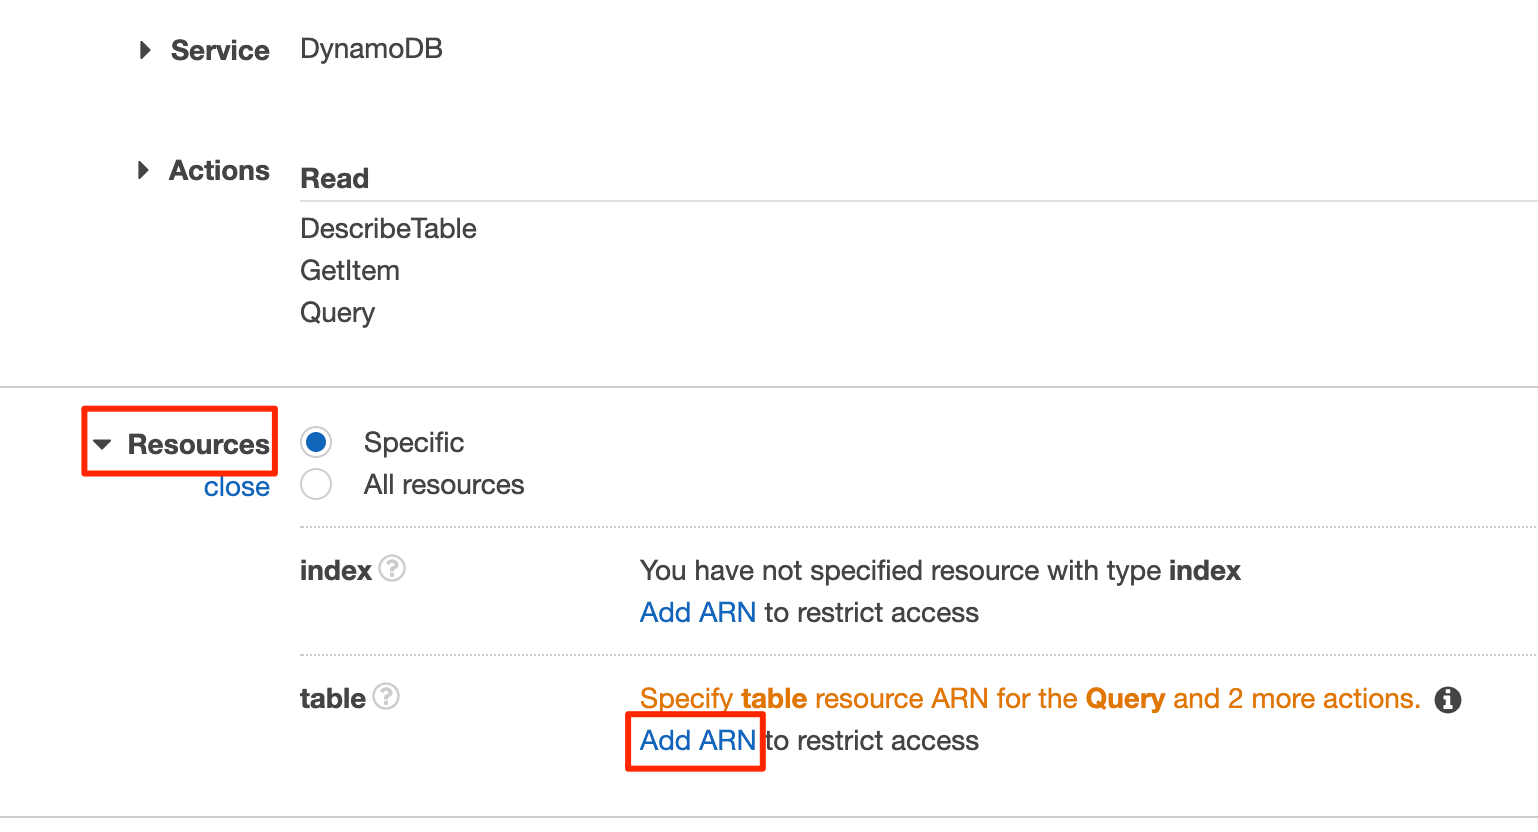
3. Create a policy that grants read-only permissions for a specific DynamoDB table.
- Select DynamoDB from [Select Service].
- Enter
getItemin [Filter action] and check the box ofGetItem.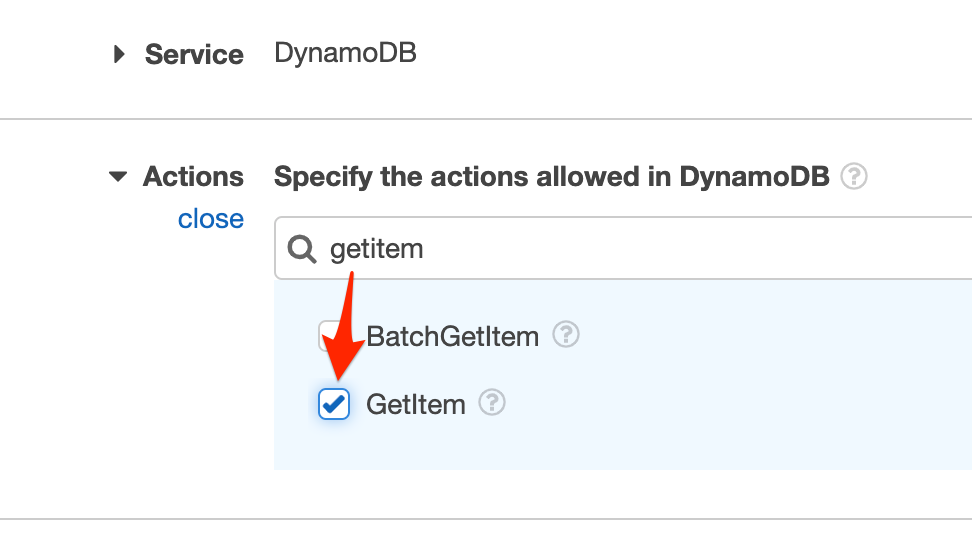
- Enter
queryin [Filter action] and check the box ofQuery.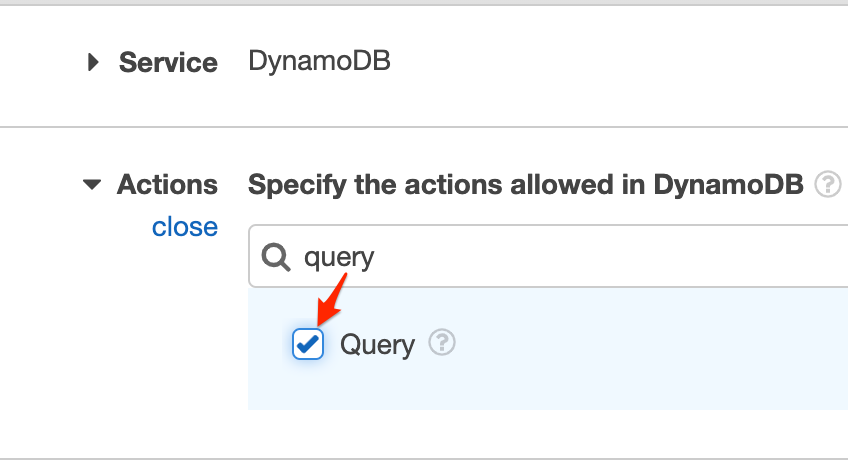
- Enter
describeTablein [Filter action] and check the box ofDescribeTable.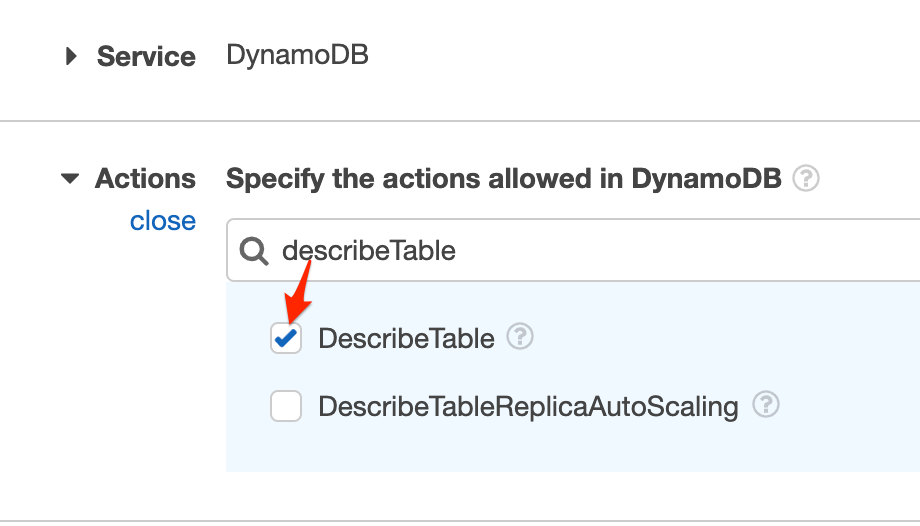
- Select Resources and press [Add ARN].
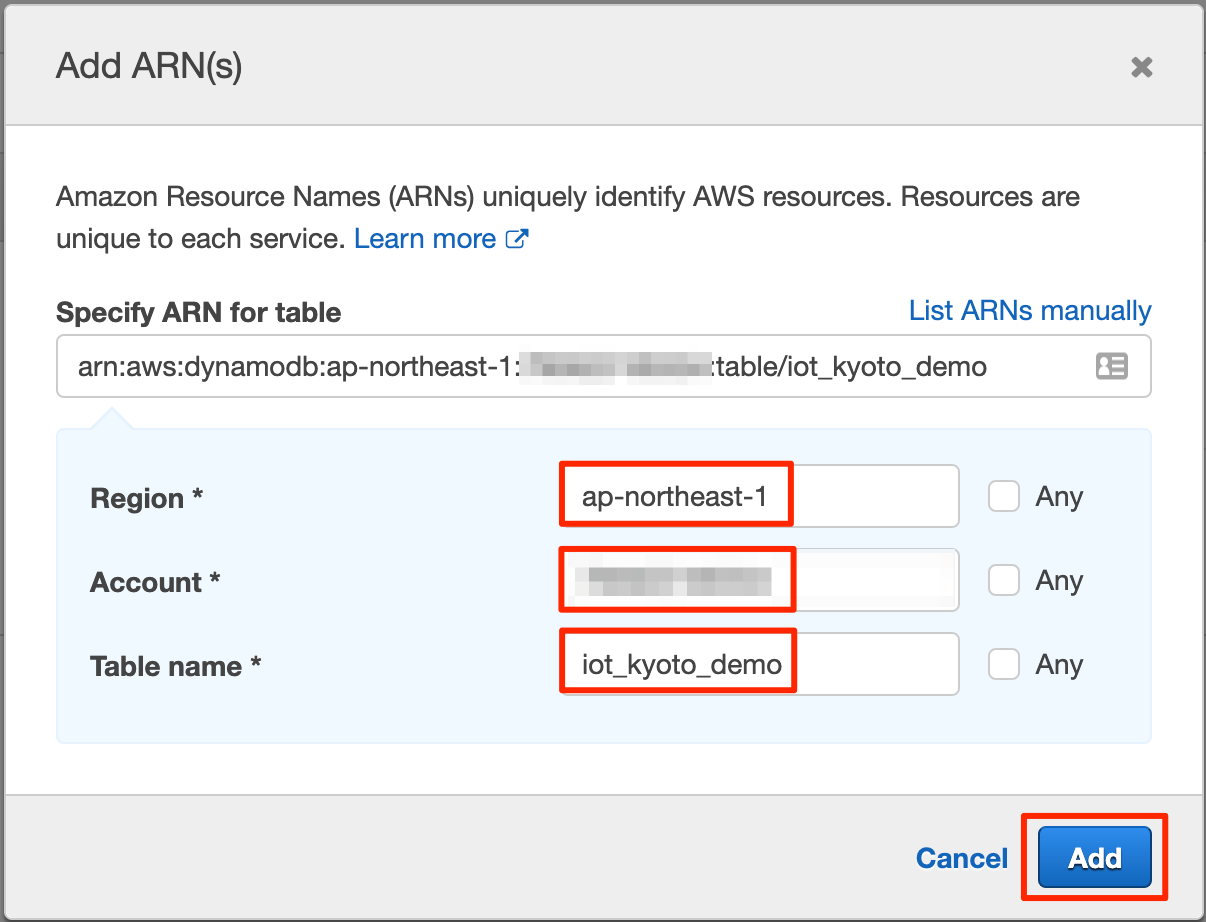
- Fill in the required information and press [Add].
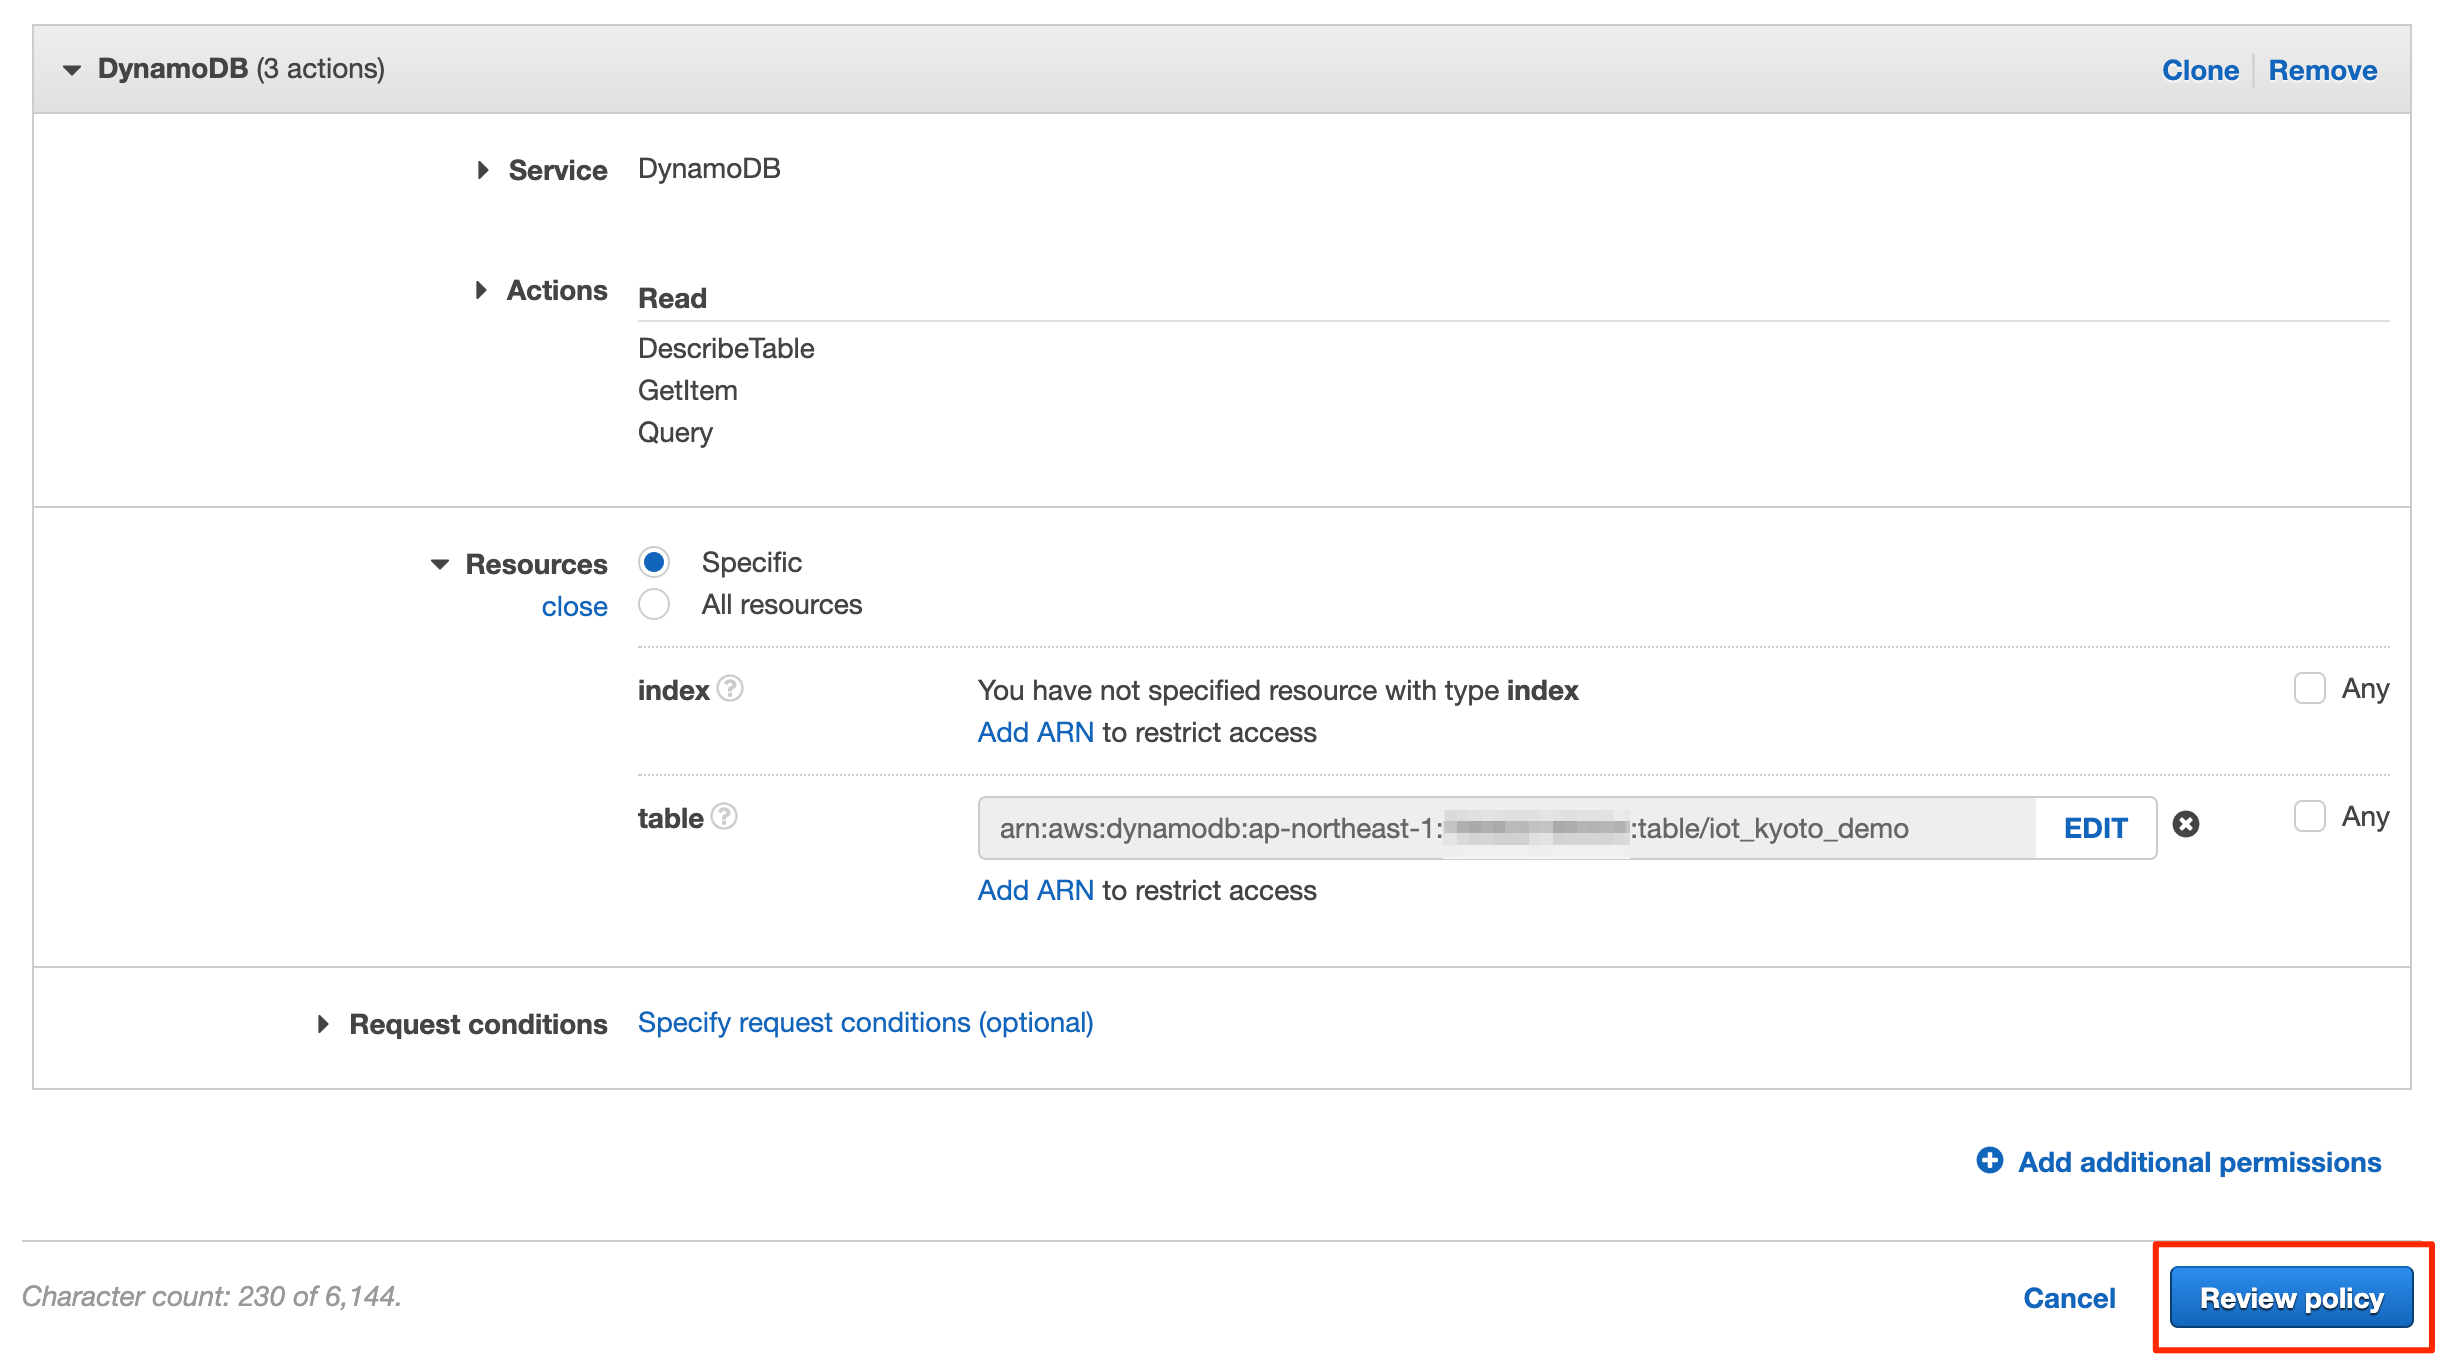
- Confirm your entry and press [Review policy].
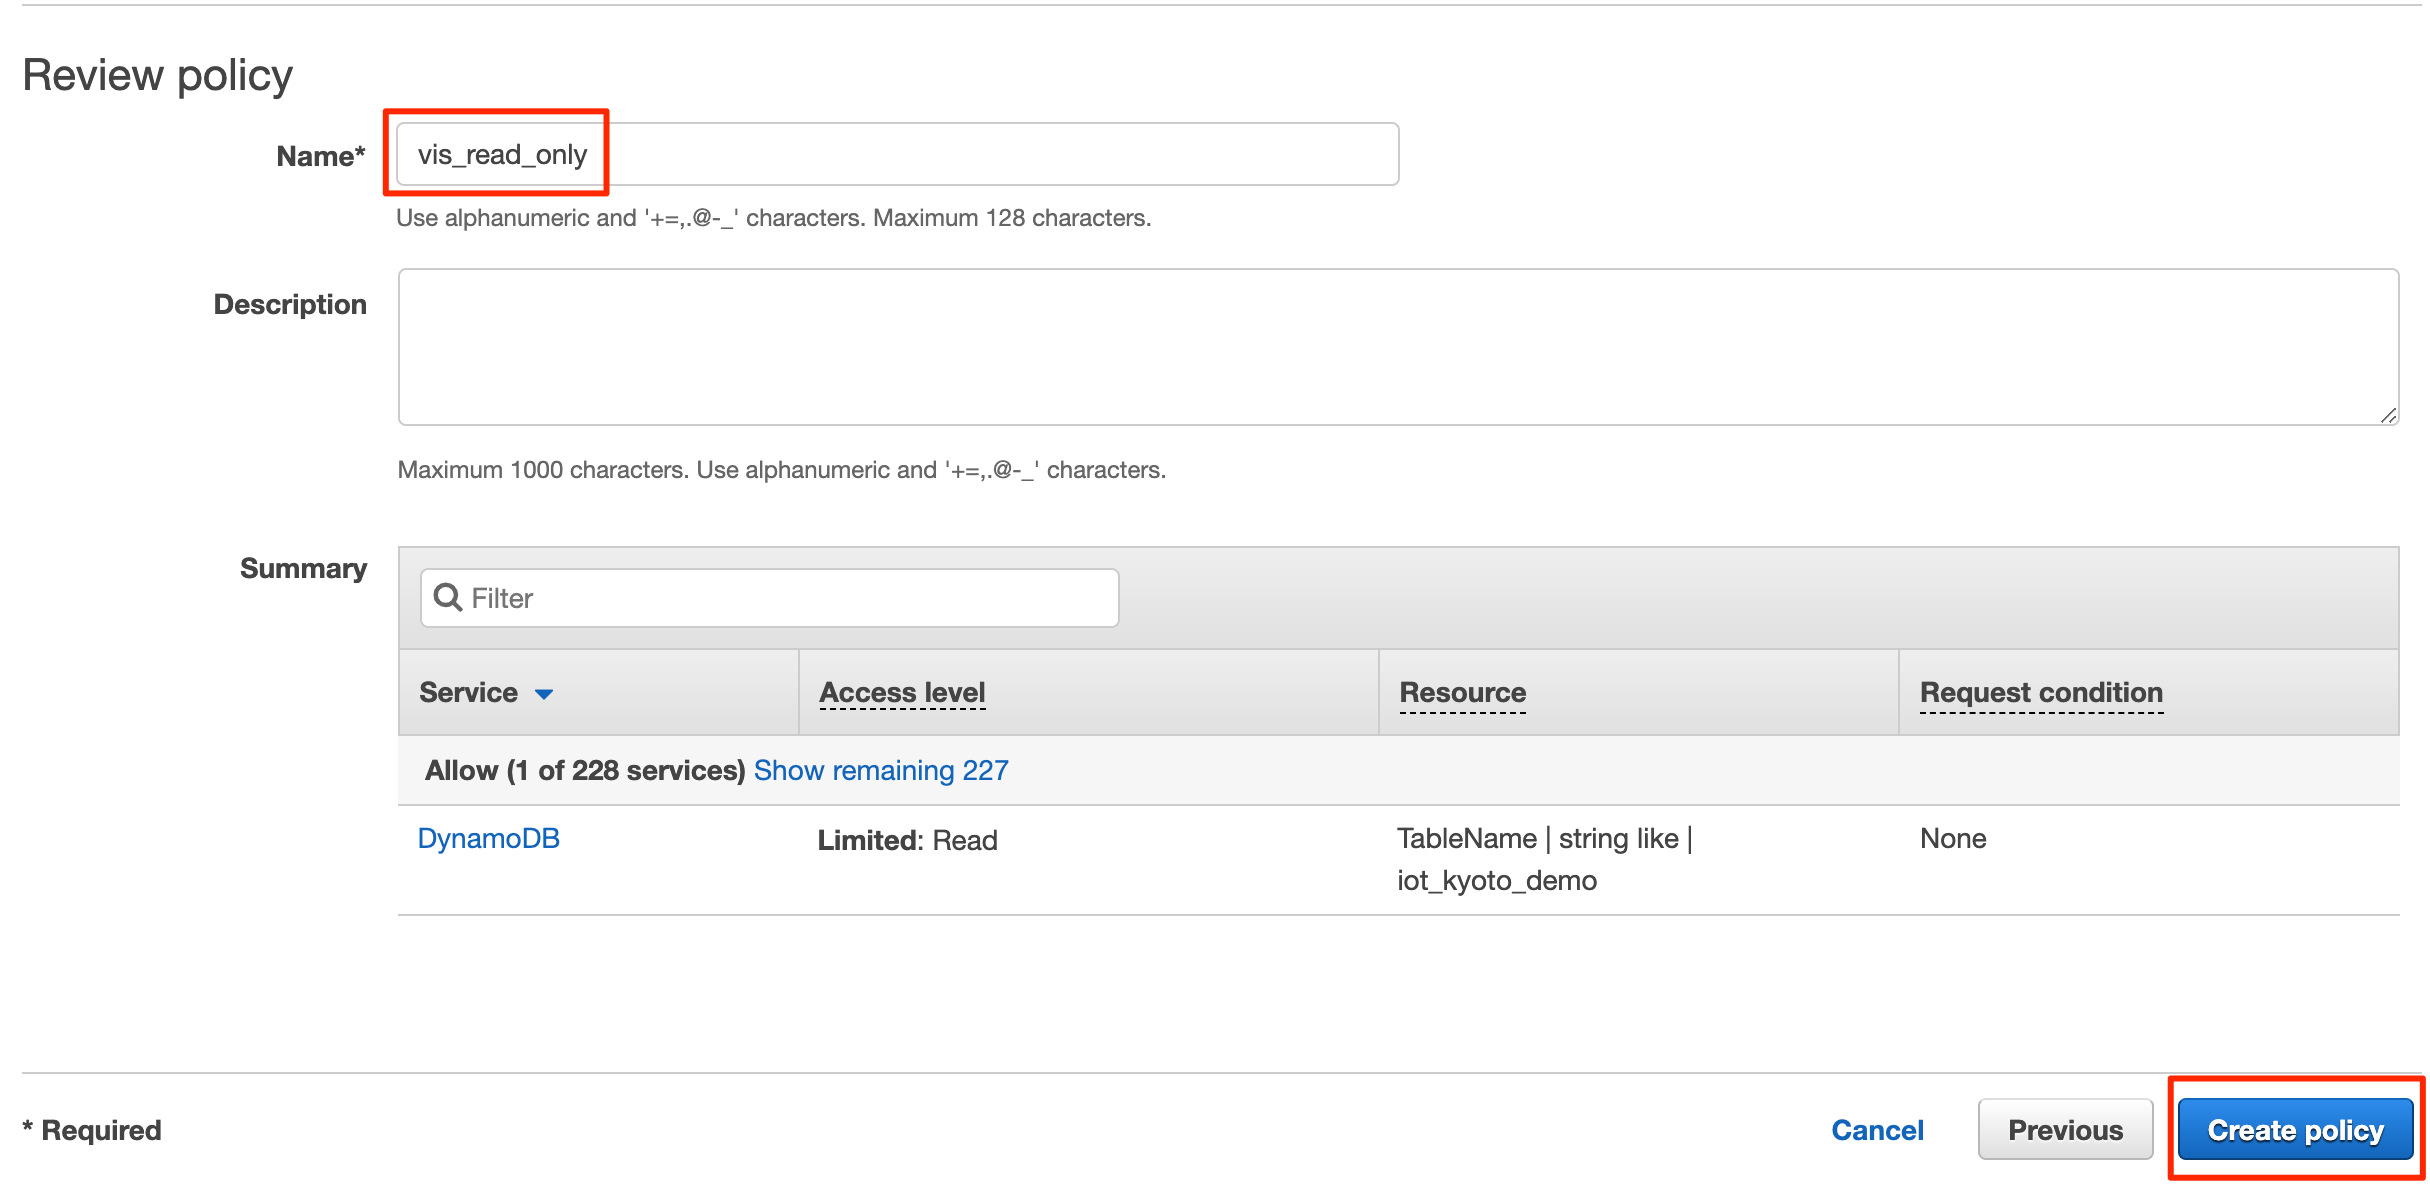
- Enter any policy name and press [Create policy].
4. Select [Users] to open it. Press [Add user] to create a user with any name.
- Check the box of [Programmatic access].
- Press [Next: Permissions].
5. Set access authority.
- Select [Attach existing policies directly].
- Check the box of the policy created in 3 and select [Next: Tags].
- Attaching the policy above may allow you to retrieve data from a specific DynamoDB table.
6. Enter [Add Tag] as desired and press [Next: Review].
7. If there is no probrem with the content, press [Create user].
-
After creating the account, a CSV file that contains the user’s authentication information will be generated; press [Download .csv] and download the file.
Note: if you forget to download the CSV file, you may have to recreate the authentication information, so be sure to download it.
[Step 3] Login with your IoT.kyoto VIS account
Note: IoT.kyoto VIS does not support Internet Explorer; use modern browsers such as Google Chrome and Firefox.
0. Access IoT.kyoto VIS.
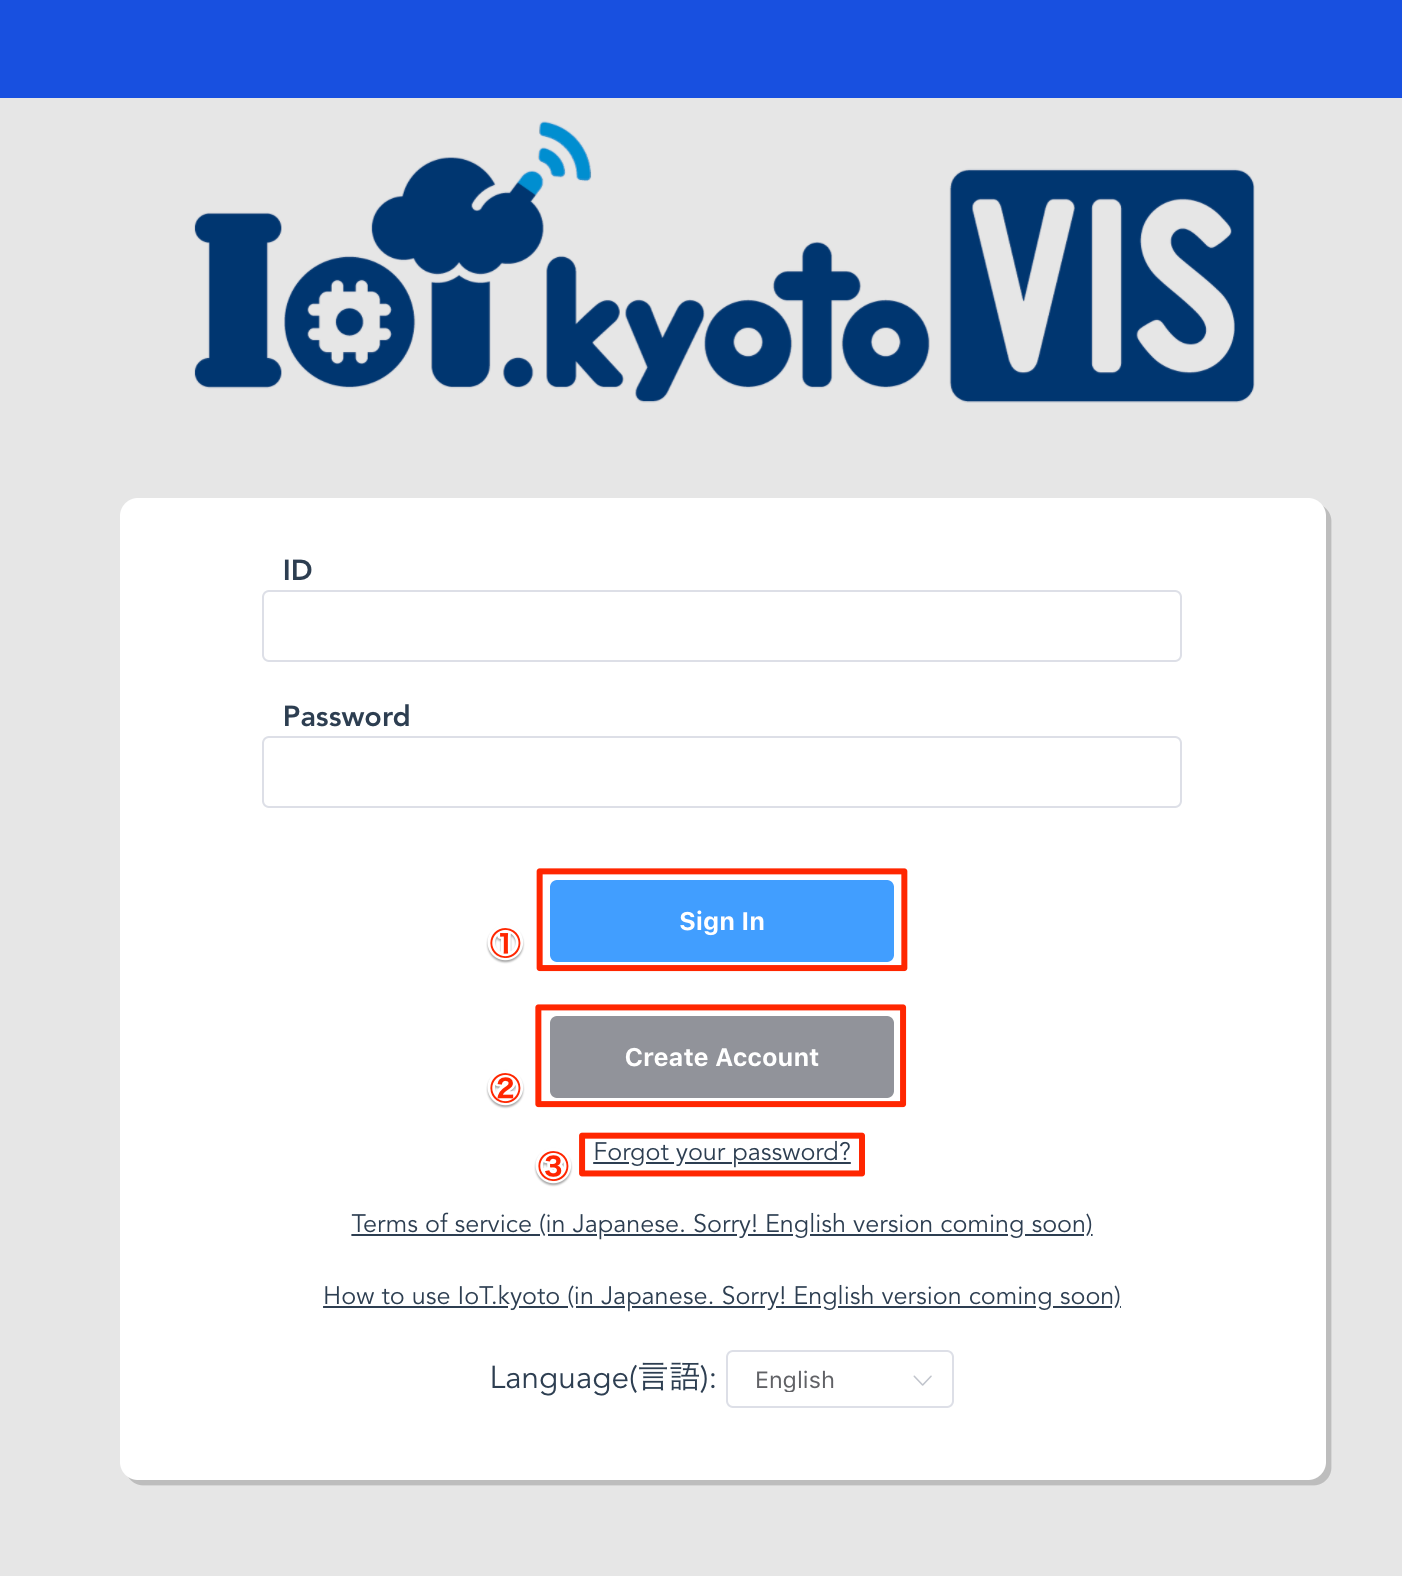
-
Sign In: sign in from here after completion of registration. (You can also use the login information registered on the old VIS site here.)
- Create Account: if you do not have an account, please create one from here.
- Forgot your password?: if you forget your account password, please reissue your password here.
1. Create an account
1.1. Press [Create Account] to go to the registration page.
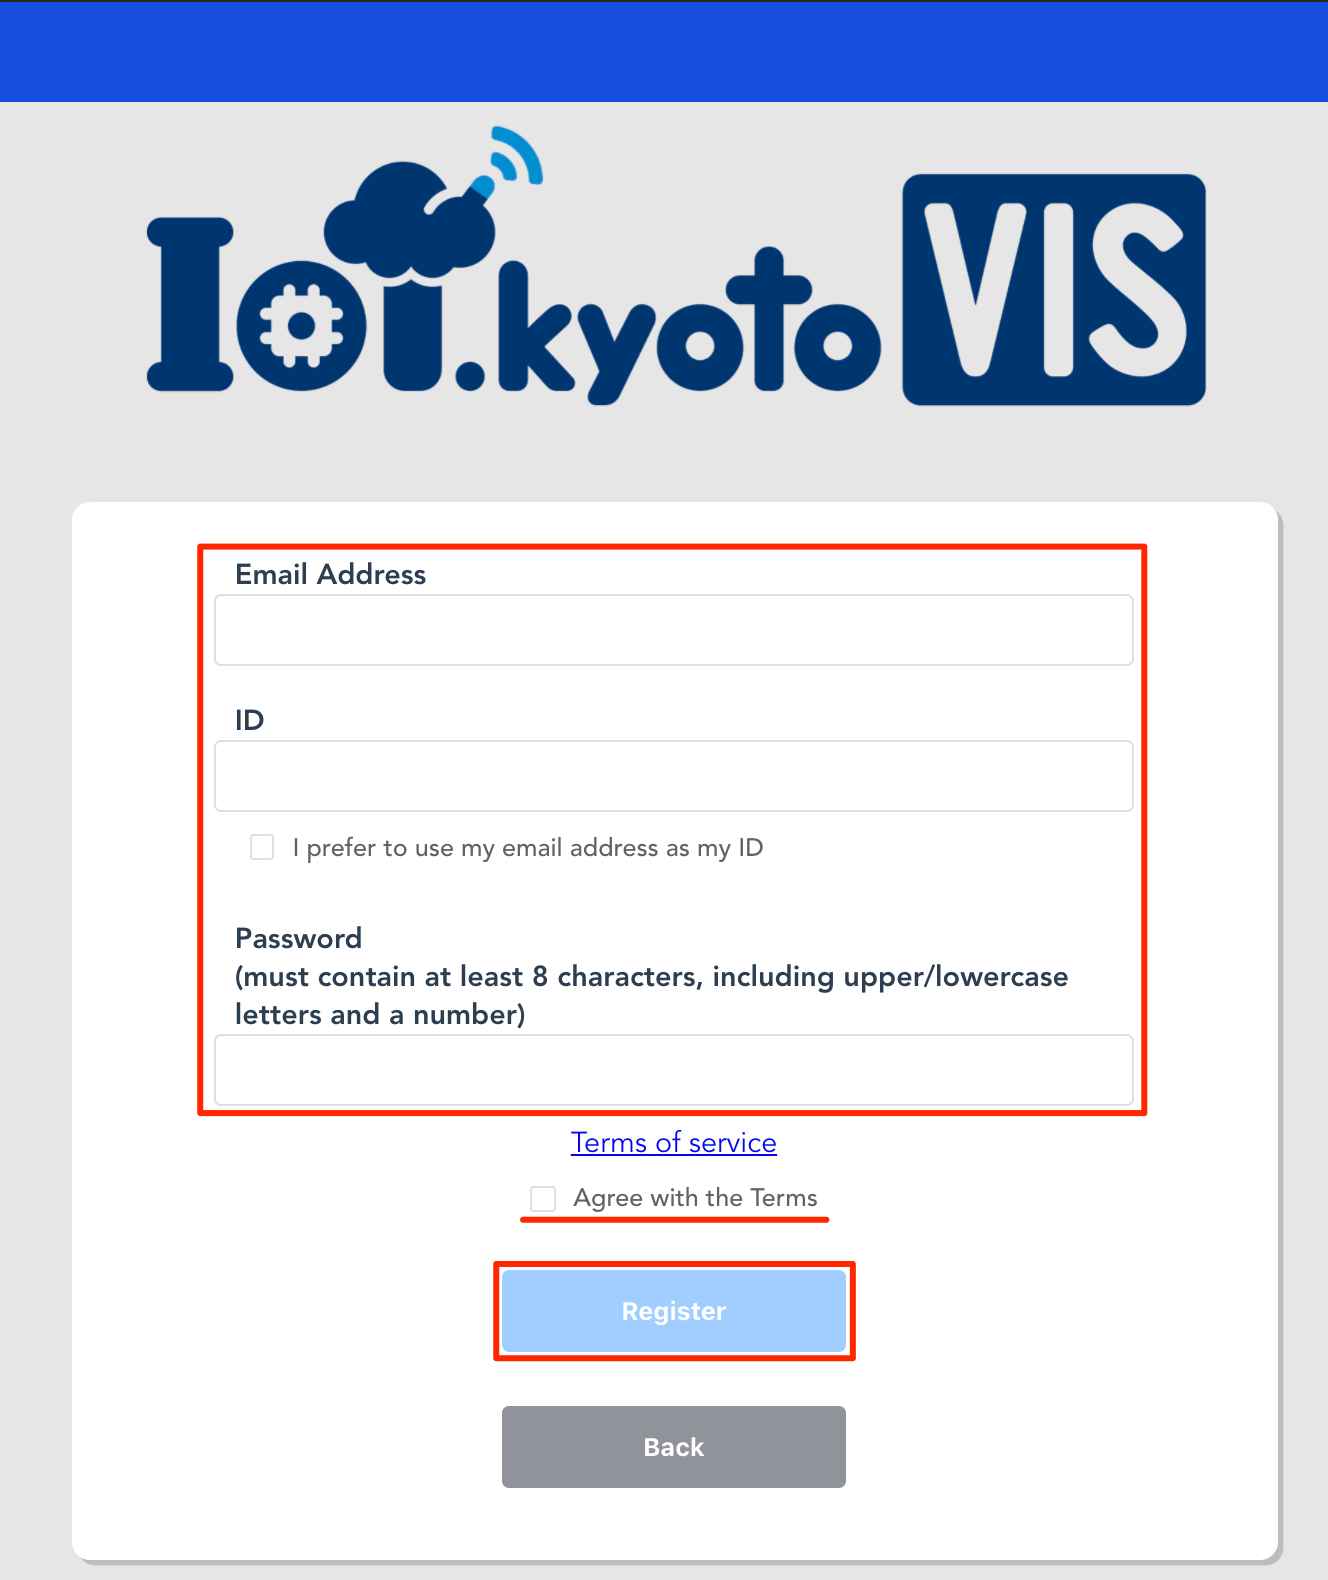
1.2. Enter your email address, ID and password.
If you prefer your ID to be the same as the email address, check “I prefer to use my email address as my ID”.
Accept the terms of service by checking “Agree with the Terms” and press [Register]; a confirmation email will be sent to the email address you entered.
Note: when setting the password, set it to 8 characters or more, including both uppercase and lowercase letters, and a number; an error may occur if this condition is not met.
1.3. Wait for the verification email to arrive.
Click the link in the email to complete registration.
2. If you forget your password
2.1. Press [Forgot your password?].
2.2. Enter your ID and press the [Reset Password].
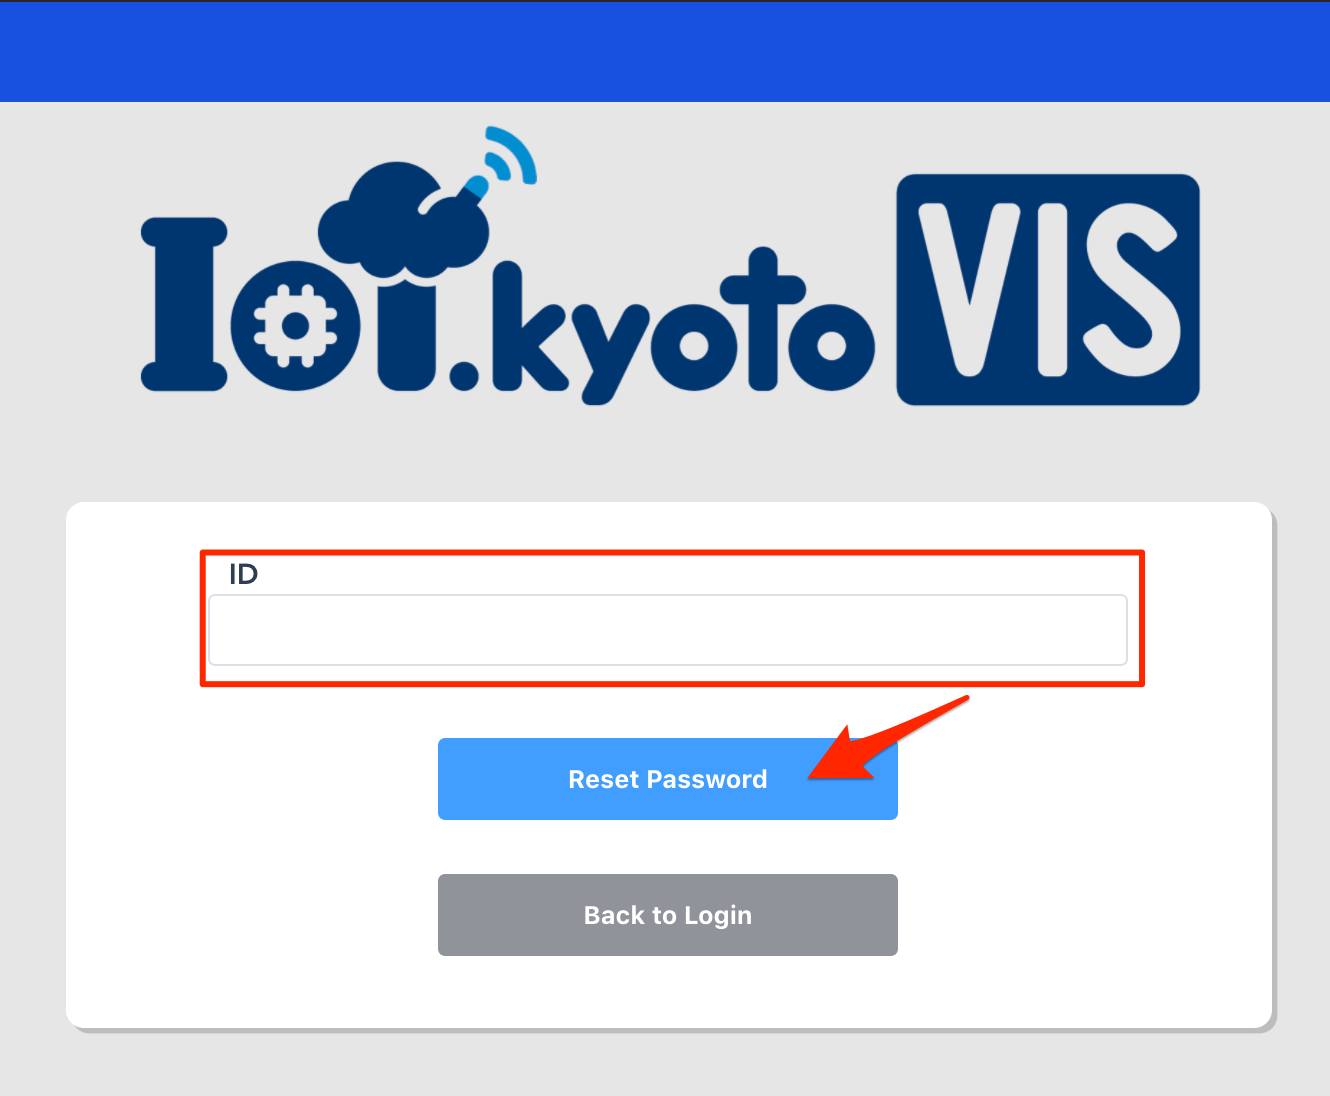
A verification code will be sent to the registered email address.
Note: your ID is required to reset the password.
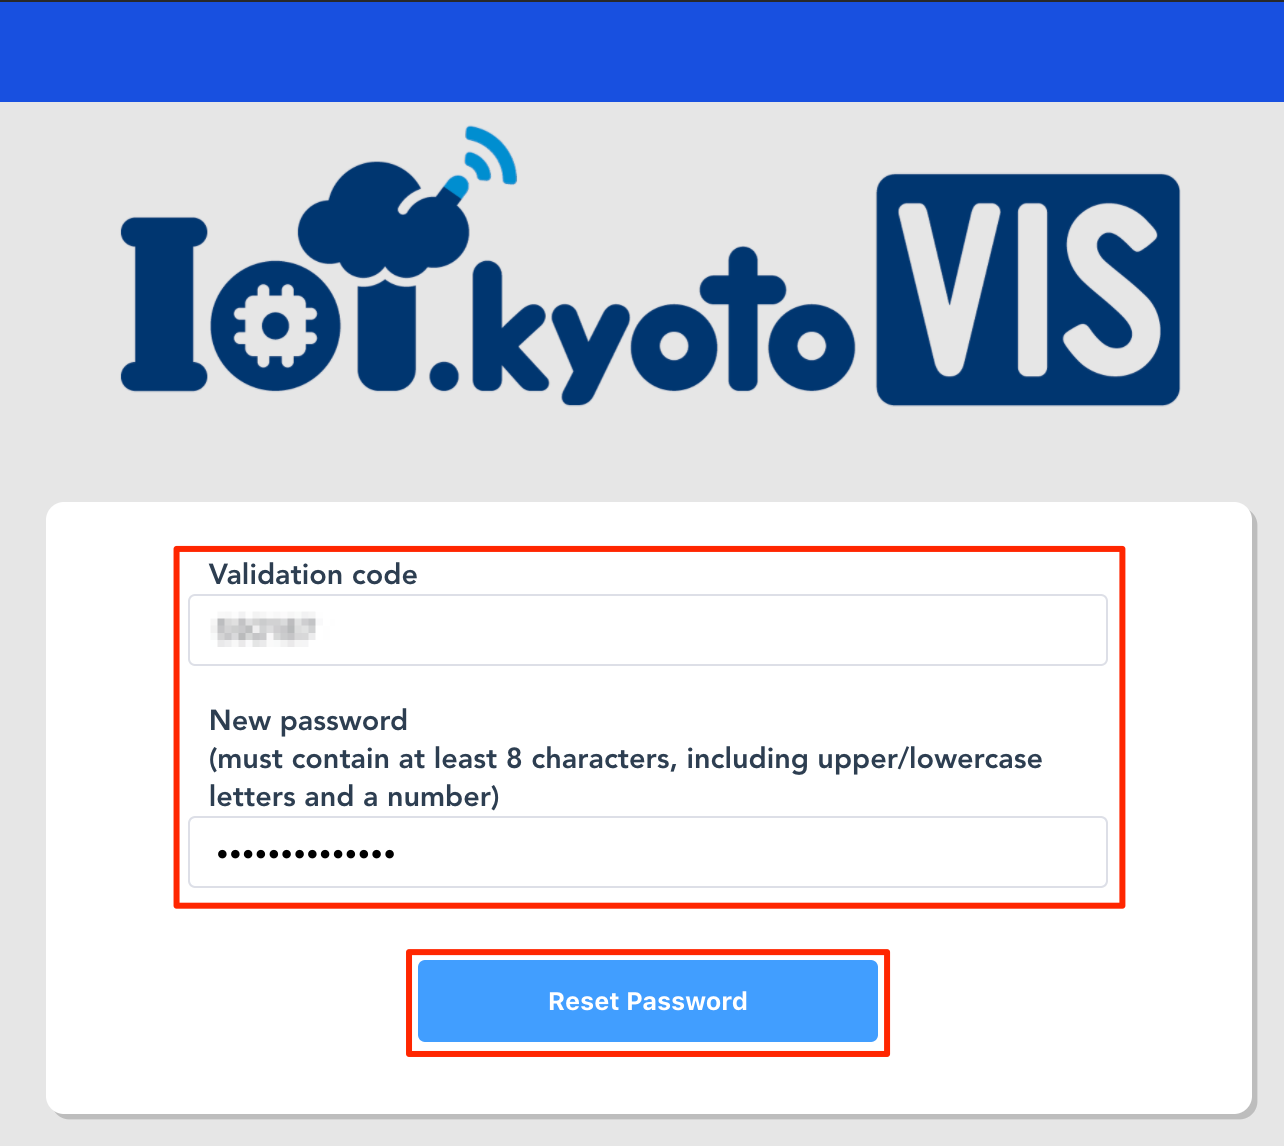
2.3 Reset the password using the verification code in the email.
Enter the verification code in the form and set a new password.
Press [Reset Password] to complete the password reset.
[Step 4] Create a graph

- General Settings: change time zone and language settings.
- IoT.kyoto: move to IoT.kyoto.
- How to Use: move to this page.
- Log out: log out.
- Add graph: add a graph.
- Rearrange panels: sort the graphs (if there are more than one).
- Change graph size: show the graphs in two columns or one column.
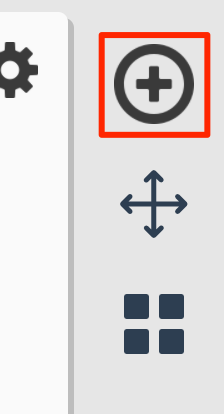
1. Add a graph
1.1. Press the [Add graph] icon.
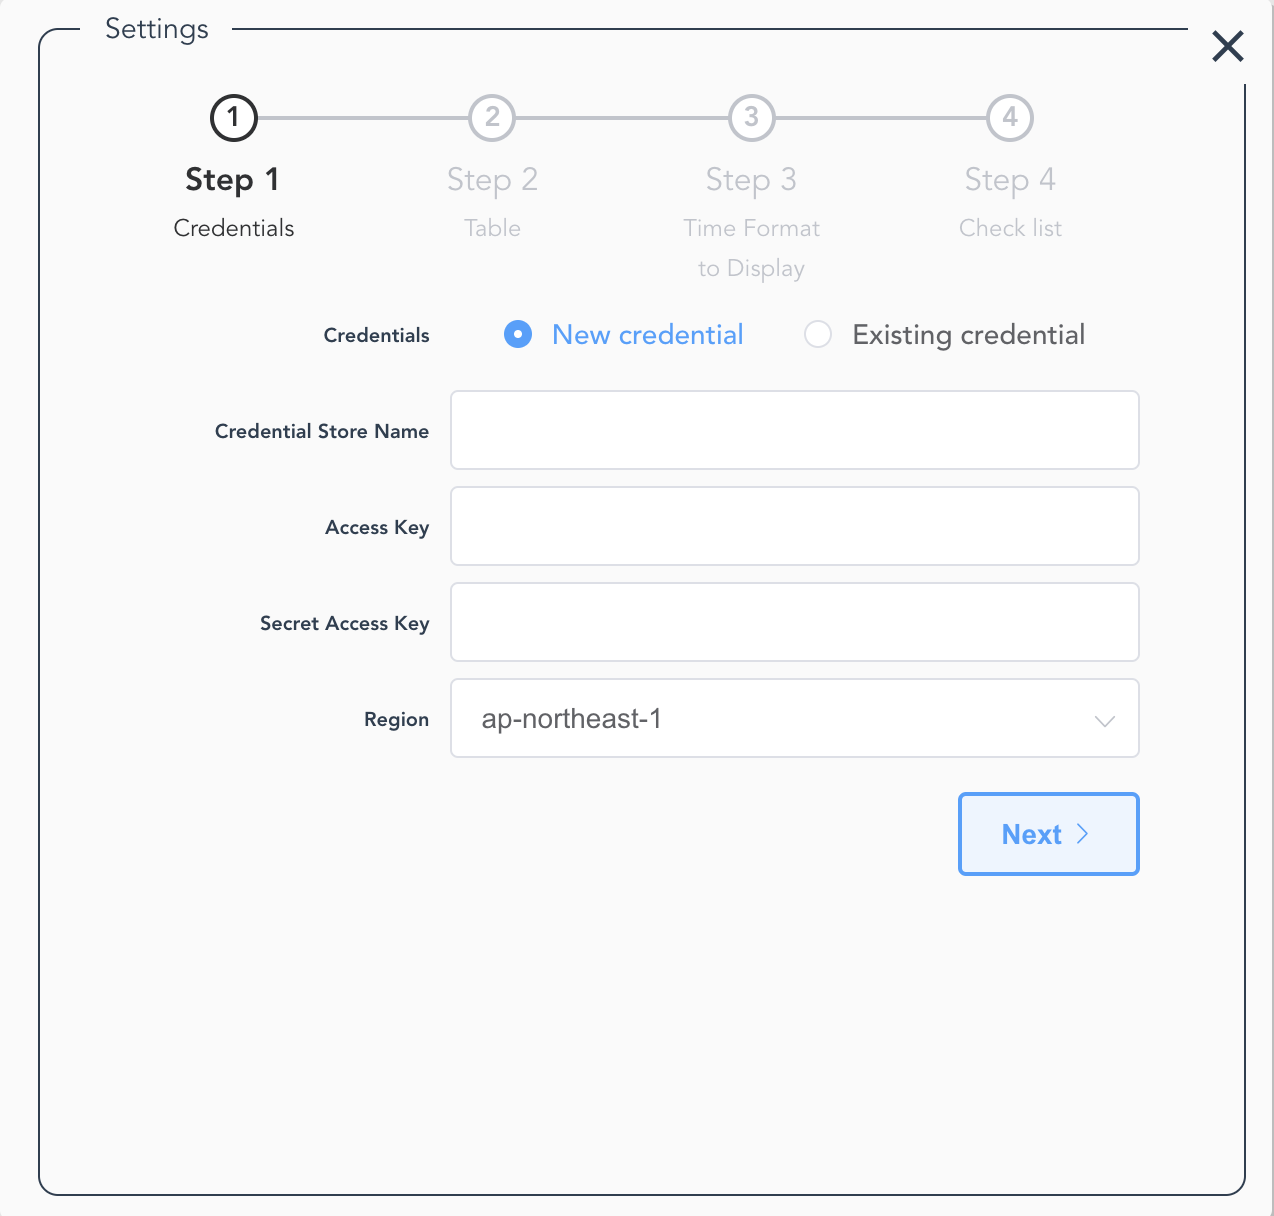
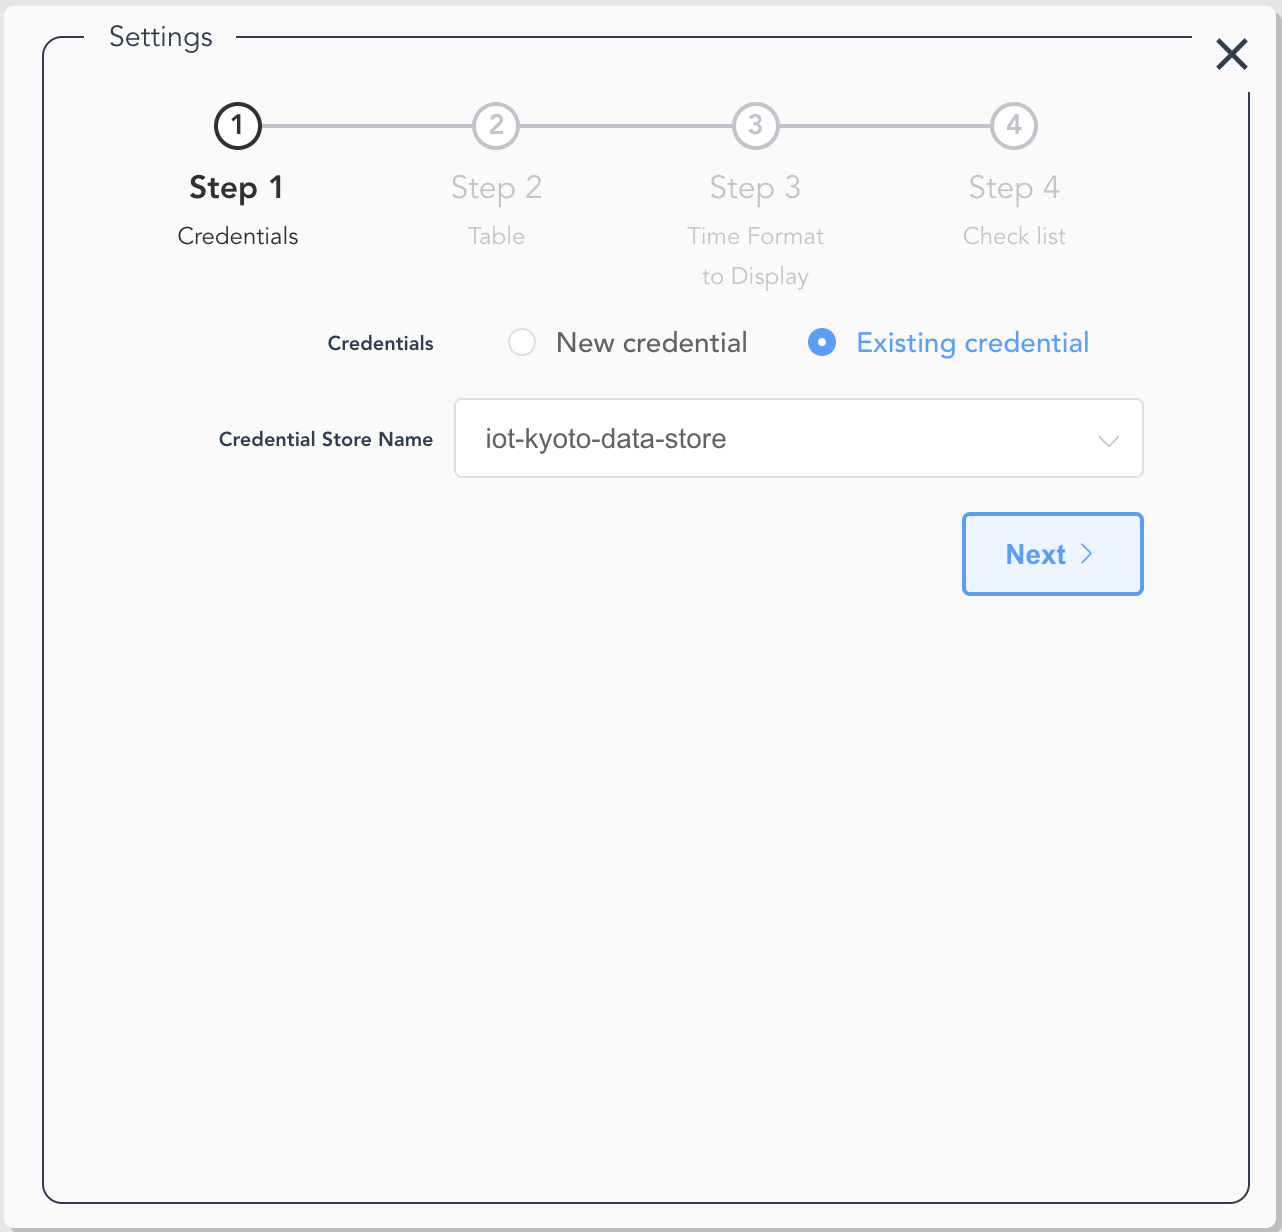
2. Set the credential.
- Enter the access key and the secret key created in [Step 2] Get IAM Access Key.
-
Enter any name for the credential store name.
Note: if you specify a name that you have already registered, it may be overwritten.
- For Region, select the region in which the DynamoDB table is created. Press [Next].
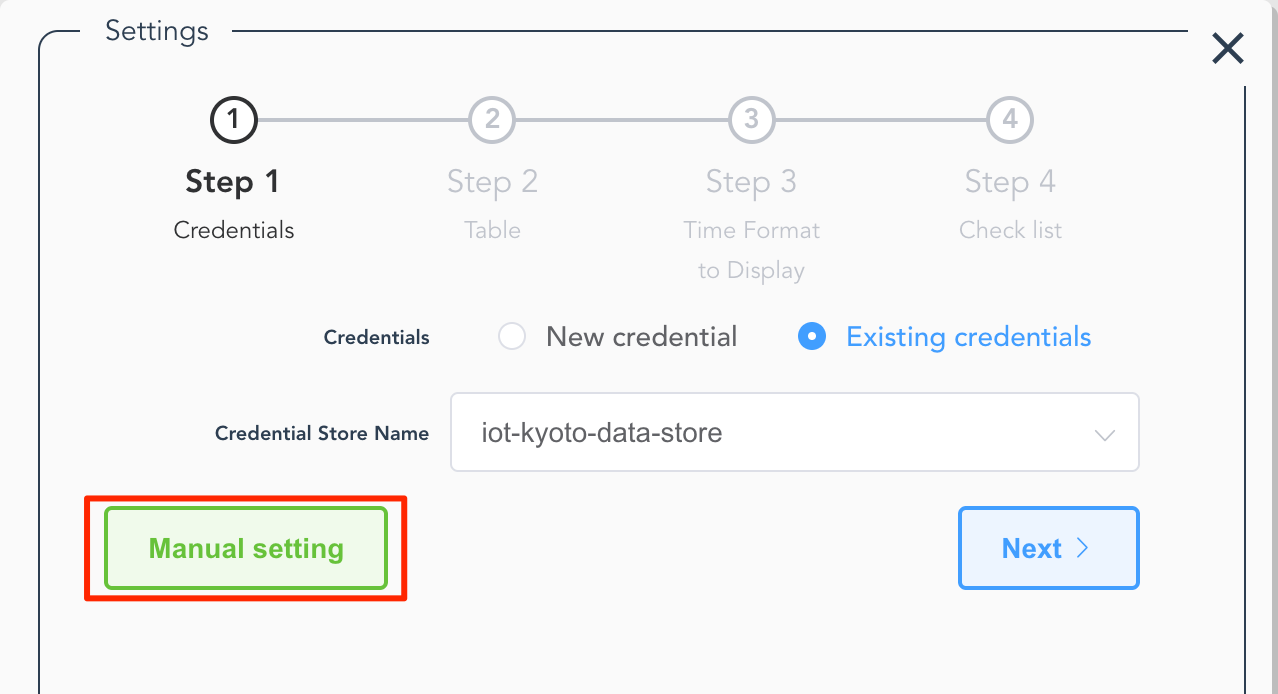
- If you want to use credentials you already registered, select [Existing credentials].
- Select the credentials you want to use. Press [Next].
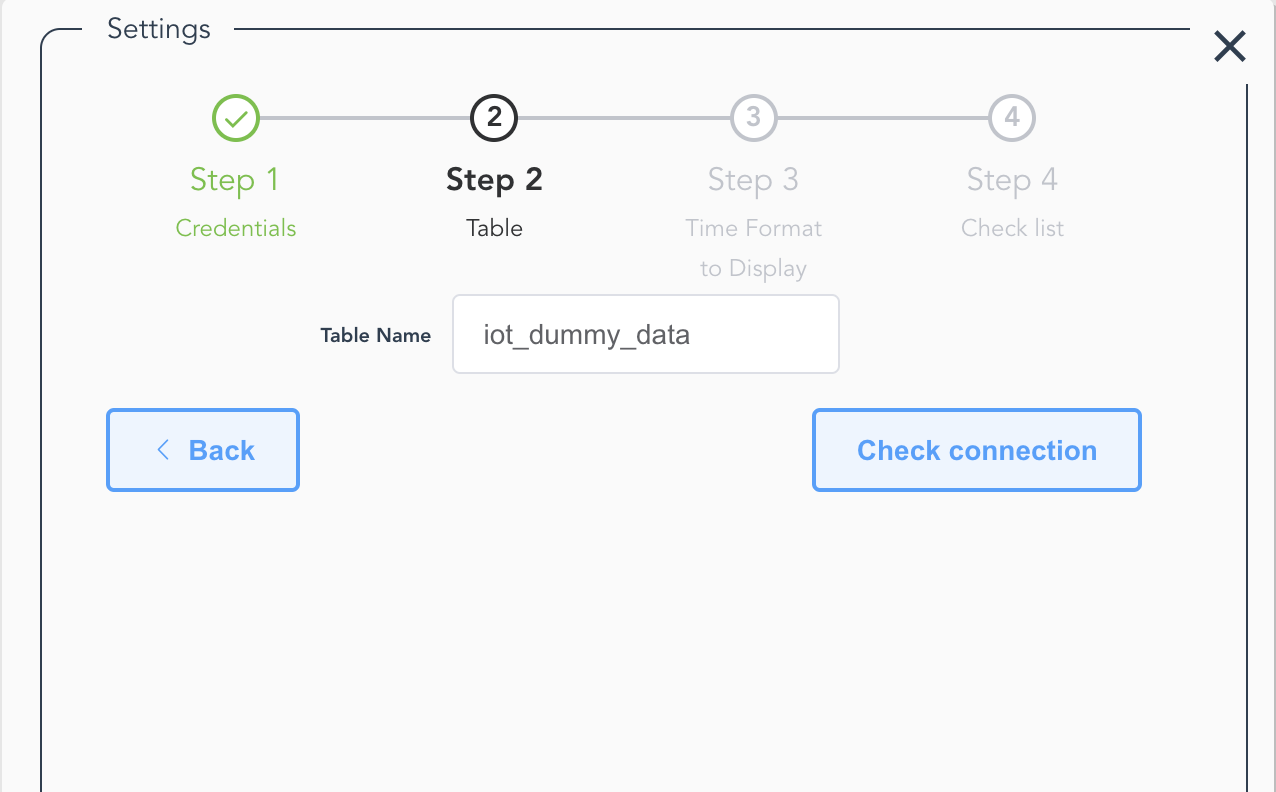
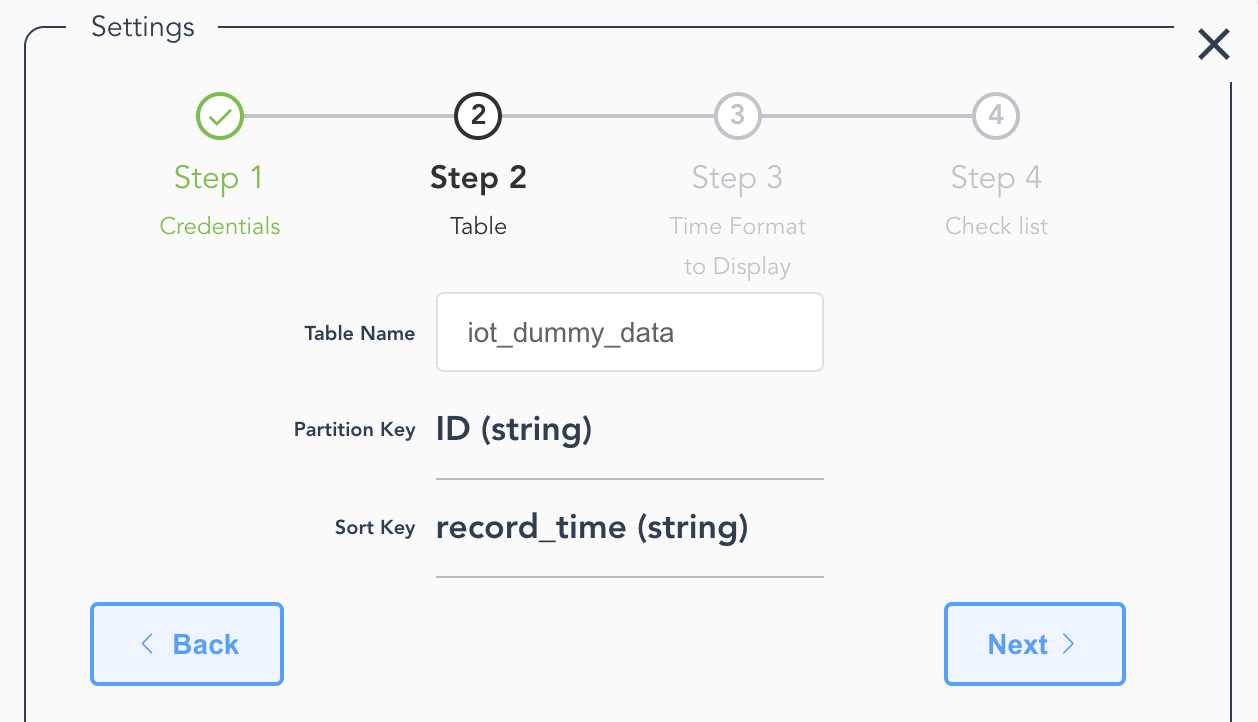
3. Enter the table name.
- Enter a name of the table with data you want to visualize.
- Press [Check connection].
- Make sure the displayed partition key and sort key of the table are correct.
- Press [Next].
Note: if the error message “Please check the table name” is shown, the table name you entered was not found. Make sure the table name is correct.
Note: if the error message “Please check the credential set in Step1.” is shown, it is possible that the authentication information is incorrect or the credential does not have sufficient permissions to access data. Please check each and if necessary, refer to [Step 2] Get IAM Access Key.
 |
 |
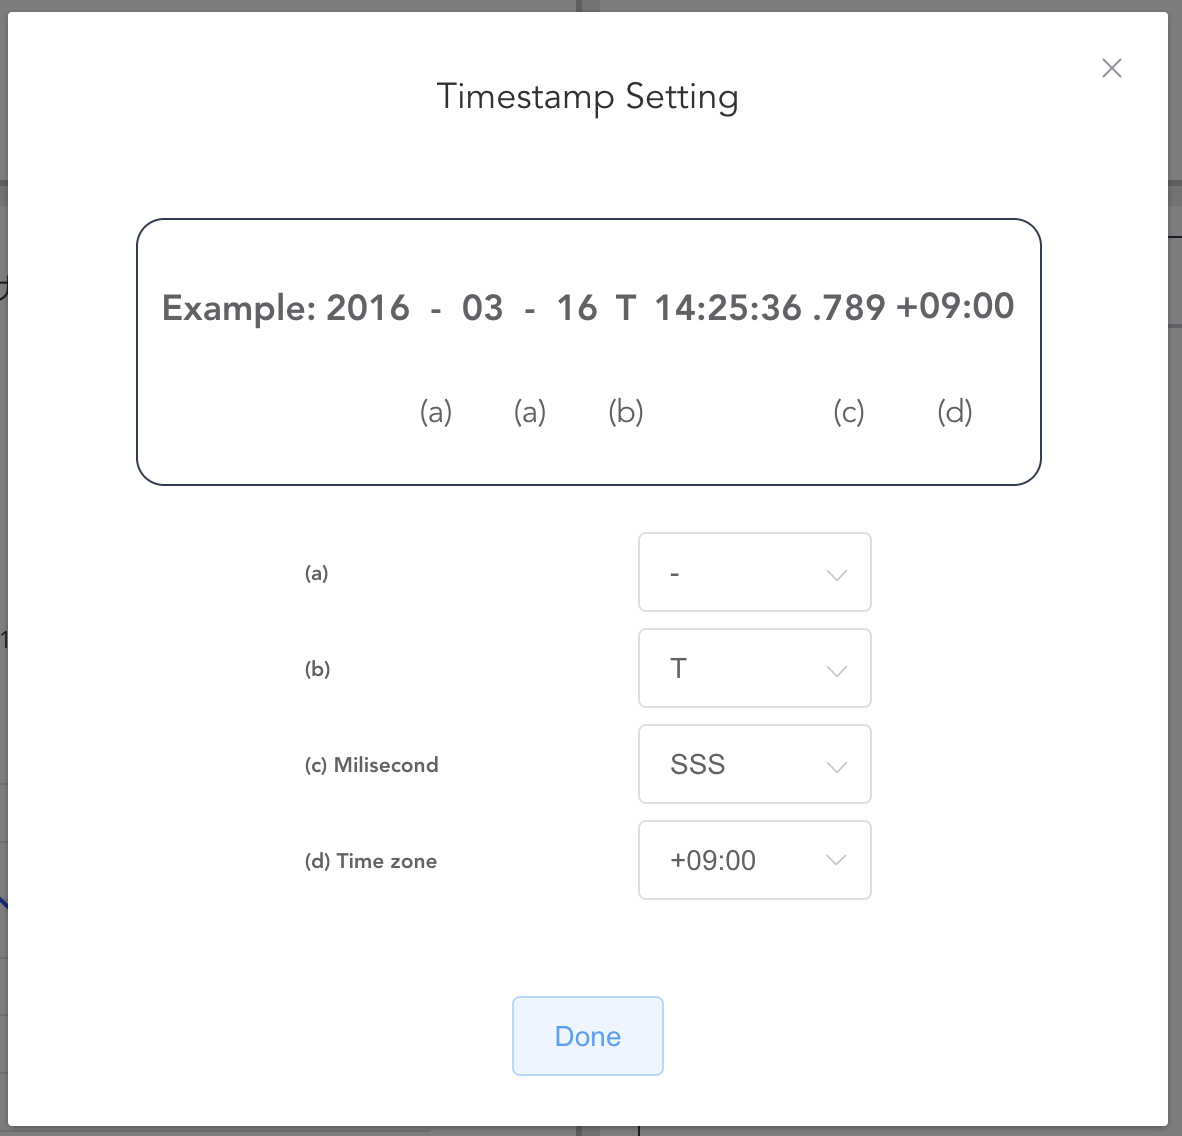
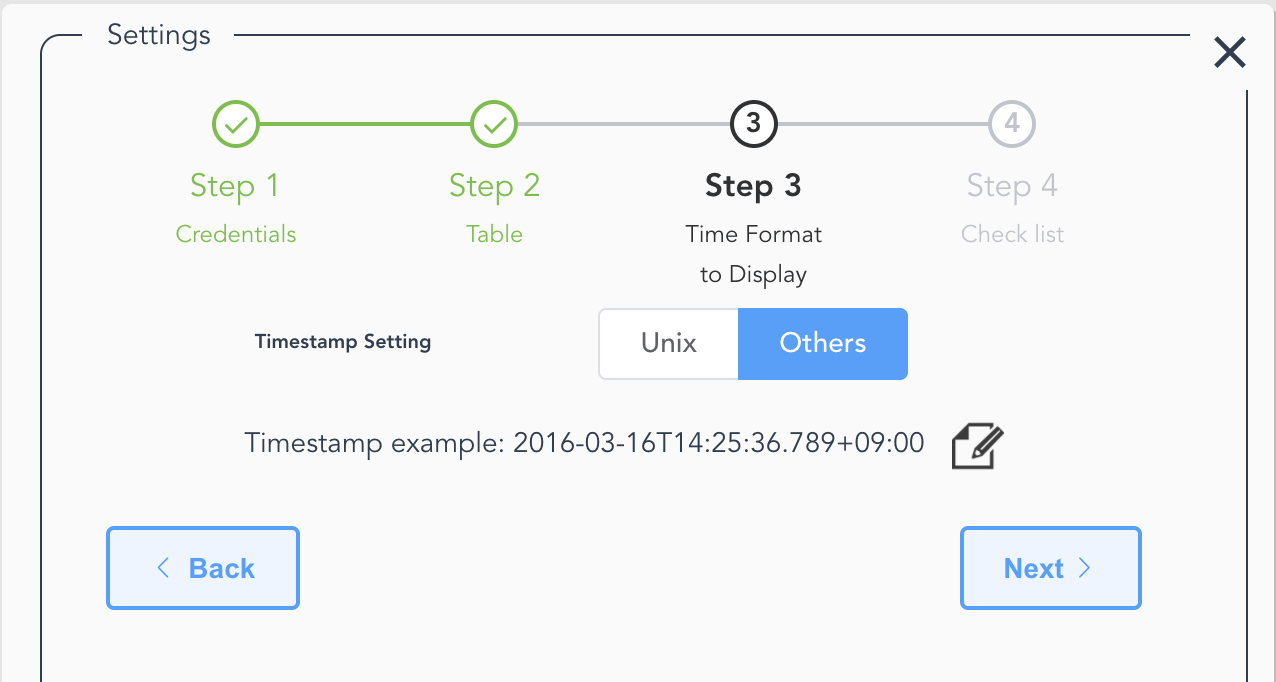
4. Set the date and time format of sensor data.
- Select [Unix] or [Others].
- For [Unix], select either 13 digits (when the timestamp includes milliseconds) or 10 digits (when milliseconds not included), then Press [Next].
- For [Others], select each part of the timestamp according to the format of the date and time data sent from the IoT device, then press [Done].
- If the time zone is not specified within the date and time, set (b) to “(empty)” and select the time zone of the sensor data date and time in [Local time zone].
- If the format looks correct, press [Next].

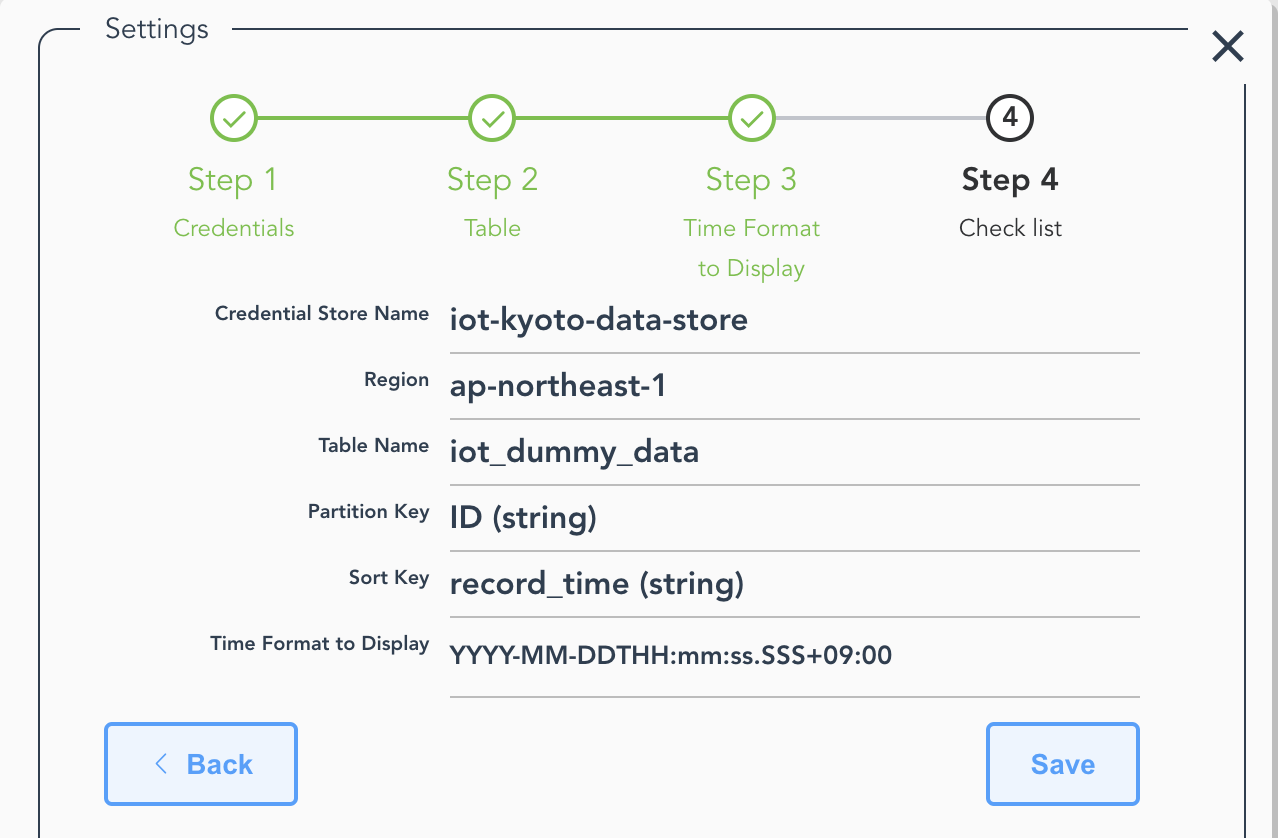
5. Check the settings and save.
- After checking the settings, press [Save].
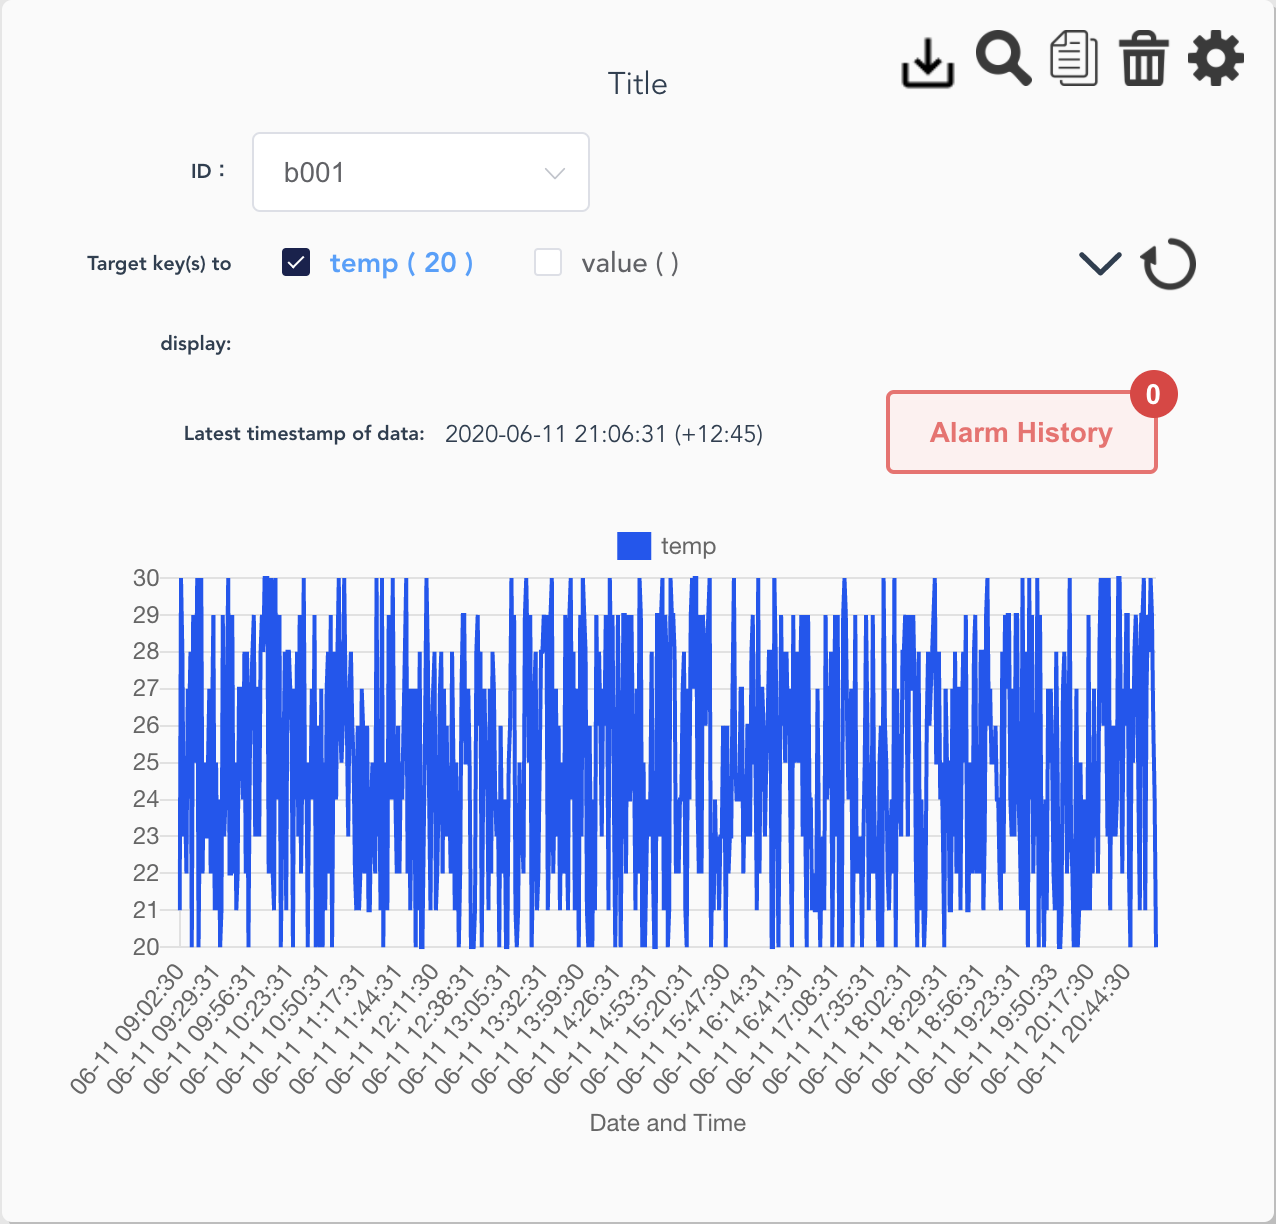
6. Select the sensor you want to display.
- After returning to the graph screen, select the sensor data which you want to see as a graph from the selector shown in the below image.
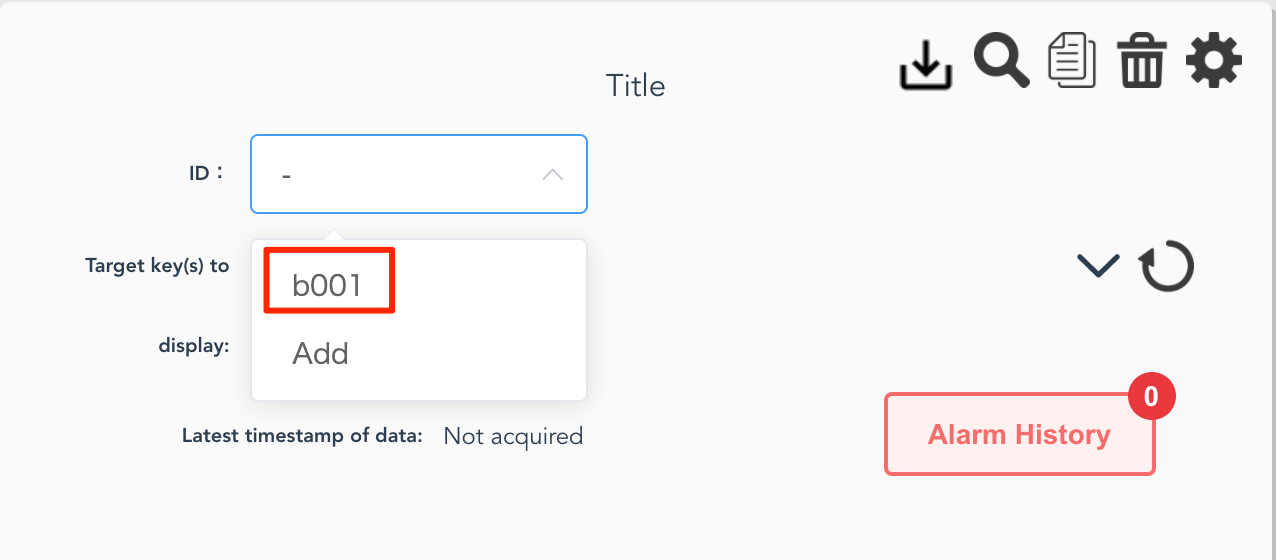
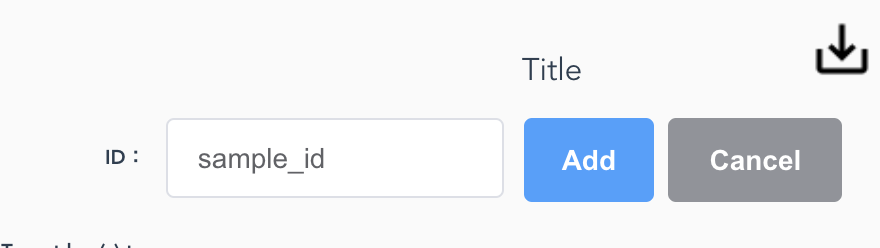
When there is no sensor to display
- Select [Add] in the selector.
- Enter a value of the partition key you want to be graphed in the form and press [Add].
- Press [Cancel] to return to the selector and check the box of the key you just added.
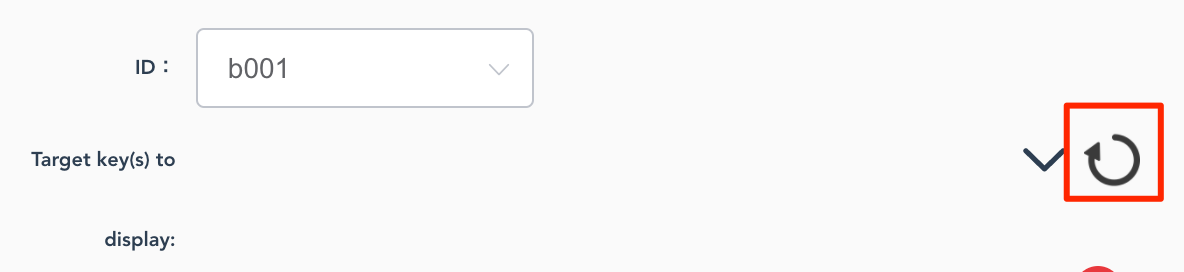
7. Select the display target key you want to display and draw a graph.
- Press the [Reload target keys] icon.
- The graph is drawn by selecting the item of the graph you want to display from the options displayed next to the display target key.
Note: graph may not be created if the latest data is older than the time range set in the graph setting (default is 5 minutes).
[Option 1] Change graph settings
Here we will show you how to set the graph title and update frequency.
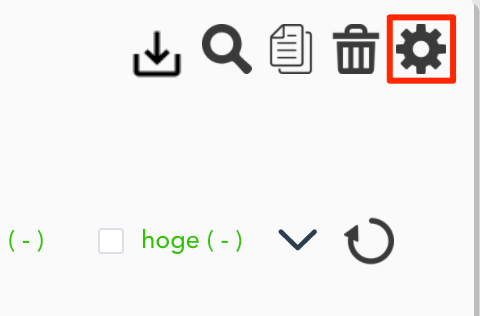
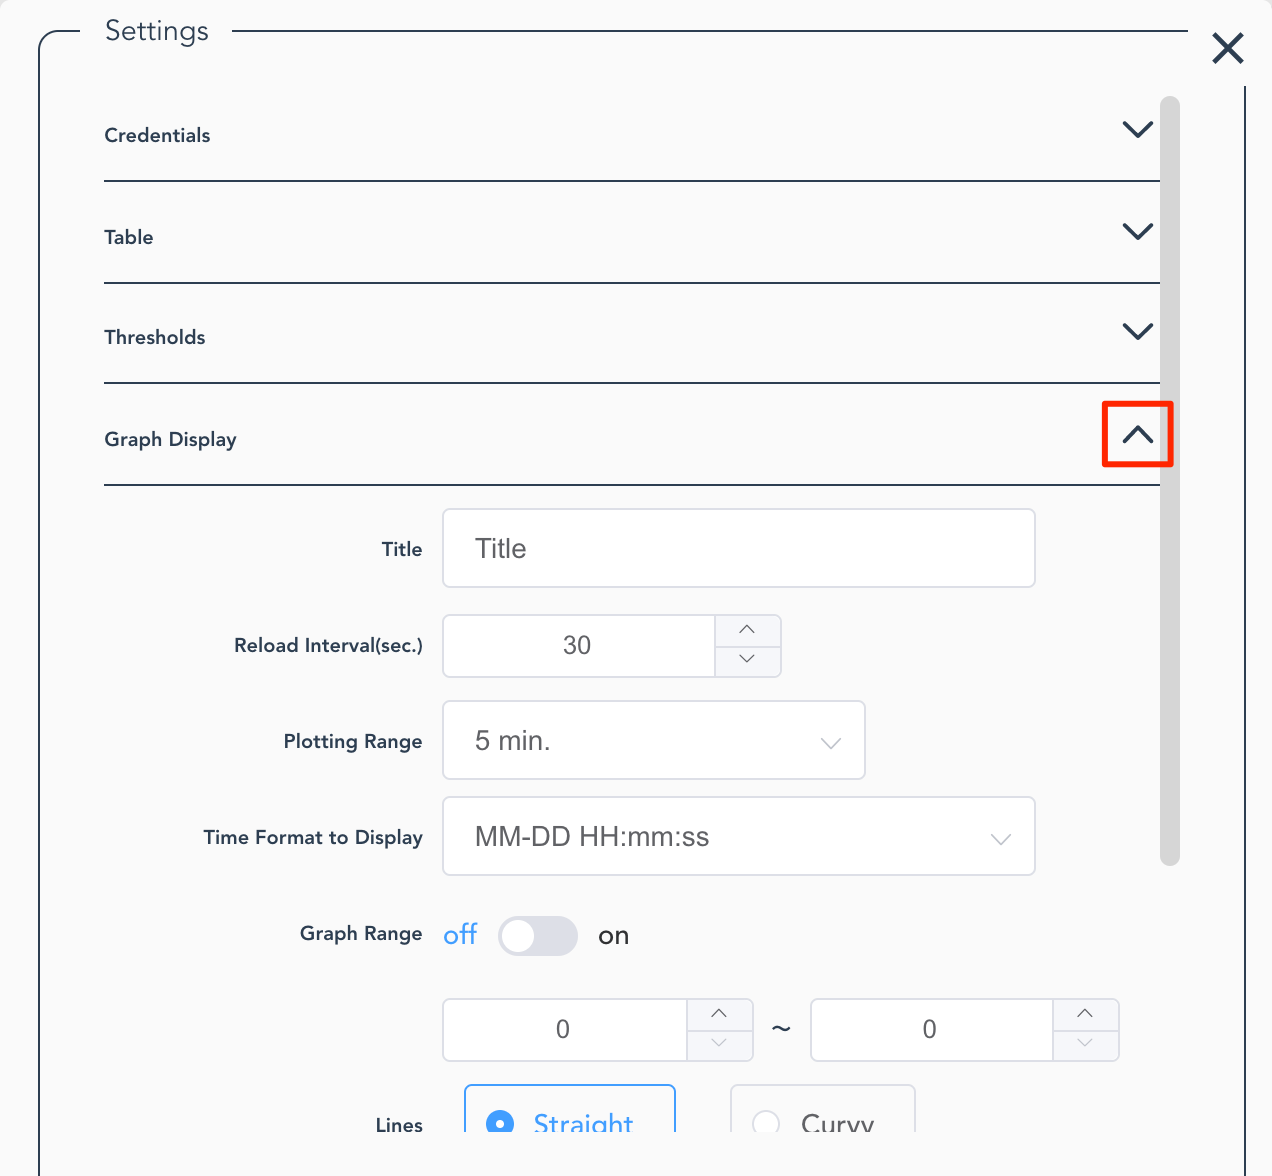
1. Go to the graph setting.
- Press the [Settings] (gear) icon on the graph panel of which you want to change settings.
- Select [Manual Setting] on the setting panel.
- Open [Graph Display] tab.
2. Change settings.
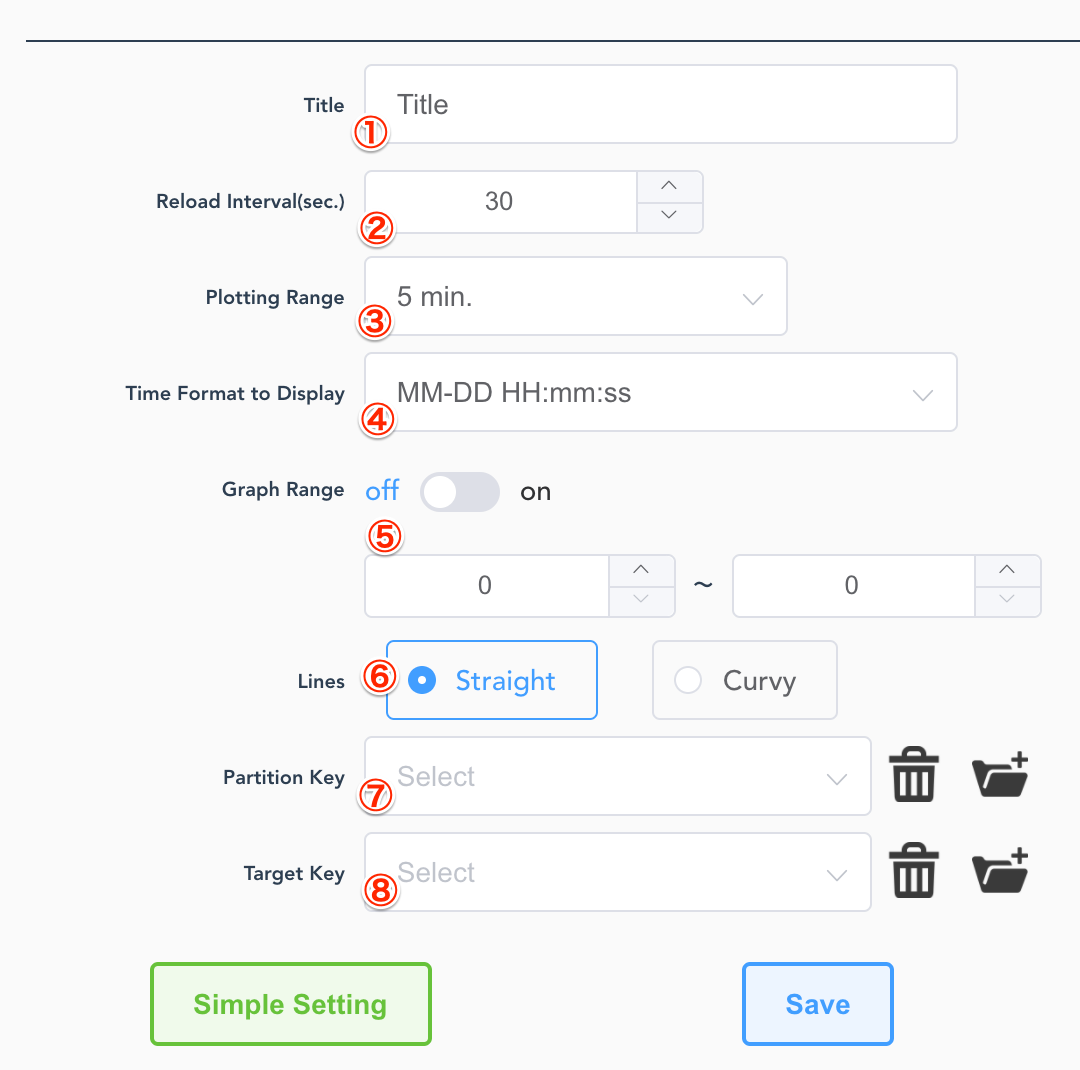
-
You can change the title displayed at the top of the graph panel.
-
You can change the interval to update the graph data.
The minimum value is 1 second. Decreasing the value may narrow the graph drawing width.
-
You can change the time range of data on the graph.
If you choose “5 min.” for instance, the data within 5 minutes of the current time is targeted for the graph drawing.
-
You can change the date and time format to be displayed on the horizontal axis of the graph.
-
You can set the range of the vertical axis.
If “off” is selected, the scale is automatically chosen.
-
You can change how to connect the graph data.
-
Selectable partition key can be deleted/added.
-
Selectable display target keys can be deleted/added.
[Option 2] Set thresholds
1. Go to the threshold setting.
- Press the [Setting] (gear) icon on the graph panel of which you want to set thresholds.
- Open the [Thresholds] tab from the setting screen
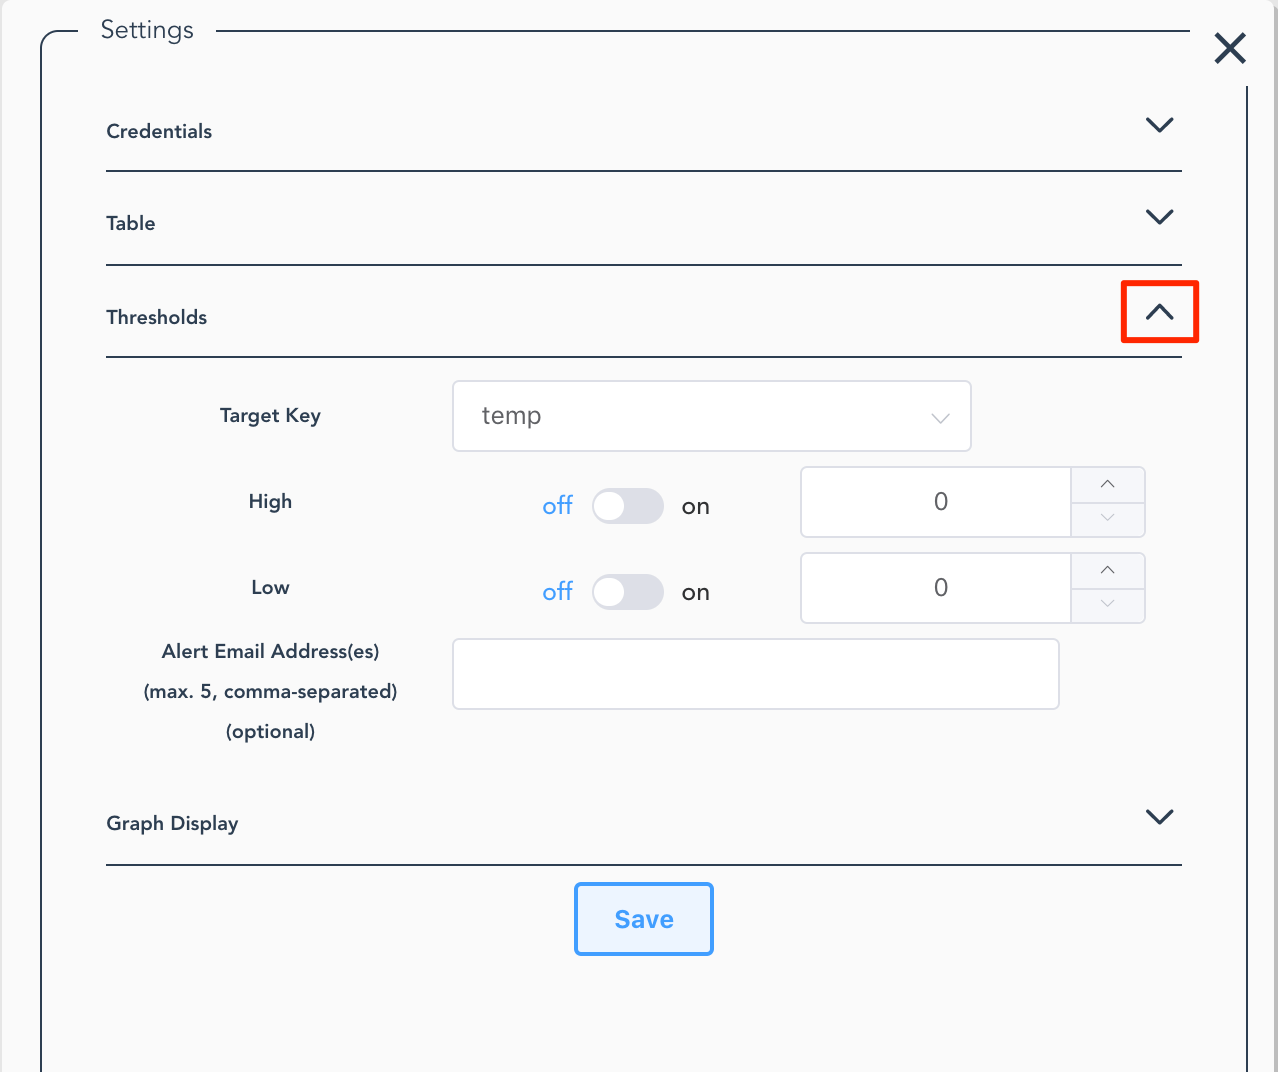
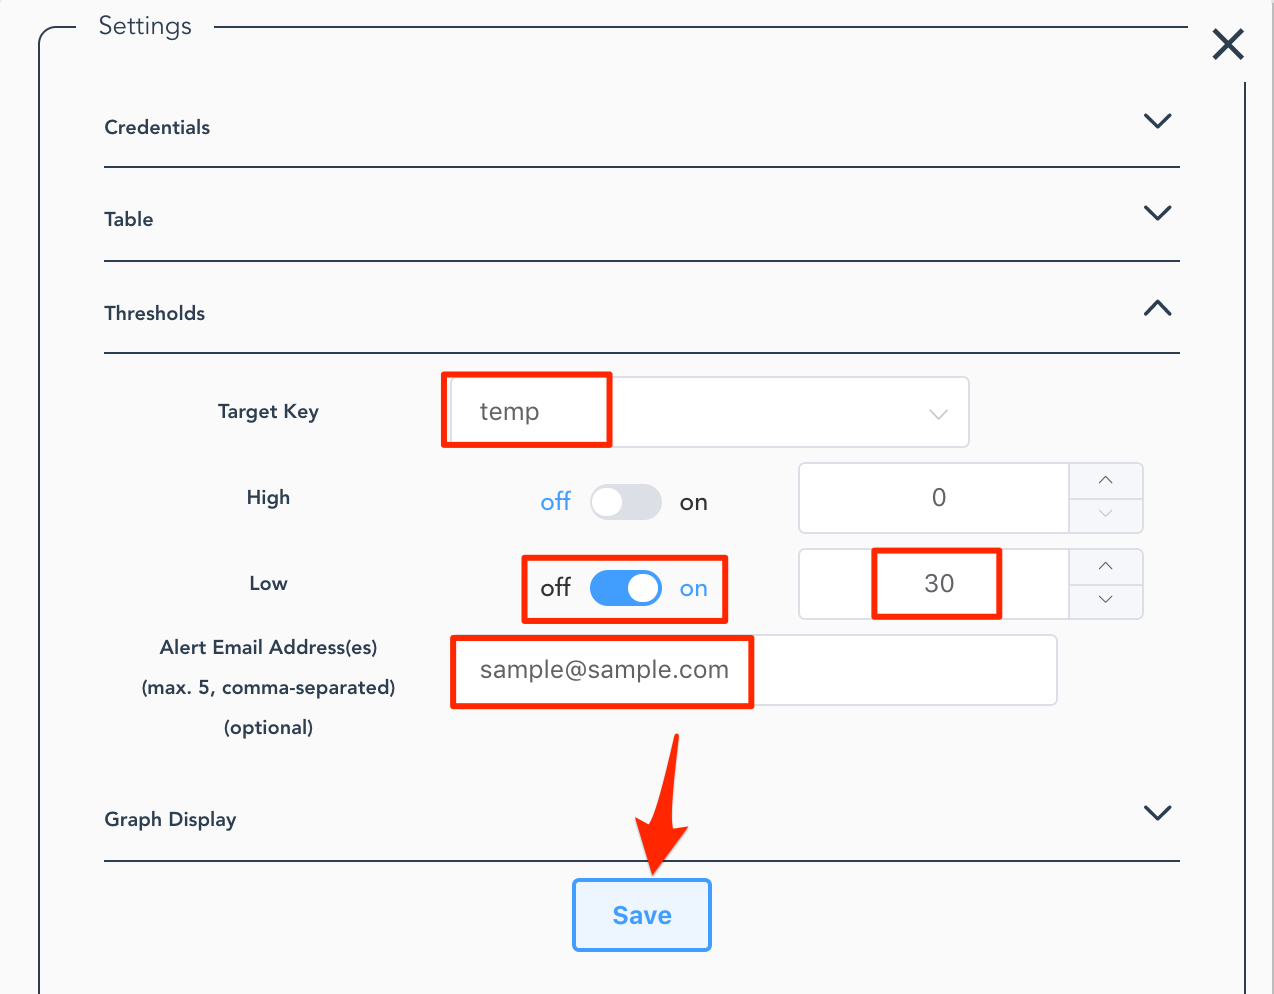
2. Set thresholds for a target key.
- Select the target key for which you want to set thresholds from the display target keys.
- Switch to enable / disable the upper and lower thresholds, and enter threshold values.
- If you want to send an alert email, enter email addresses in [Alert Email Address(es)] If you enter more than one email address, separate them with commas. Up to 5 emails can be registered.
- After setting is done, press [Save].
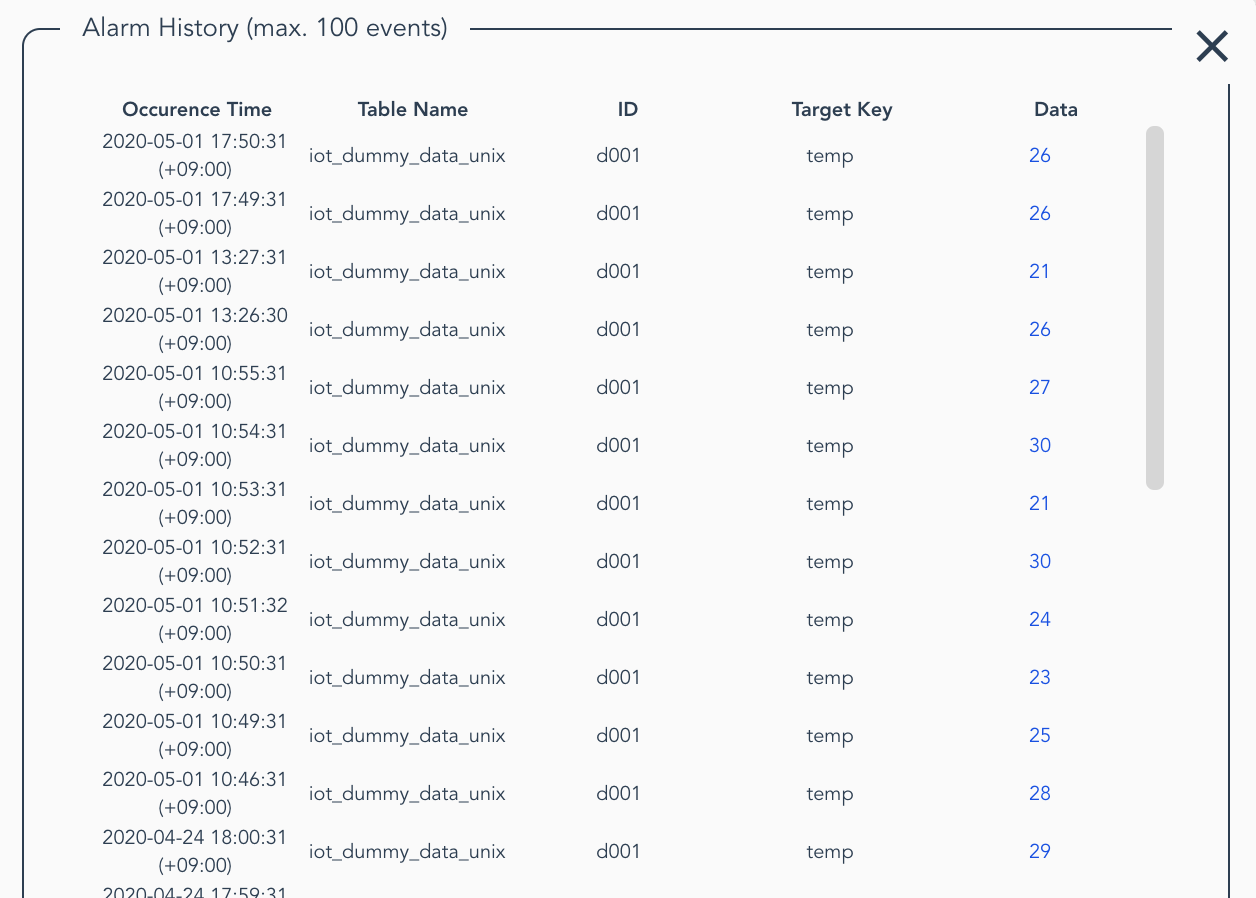
You can check the error history.
- The notification badge appears on the [Alarm History] button as the data with threshold setting exceeds or falls below the set value.
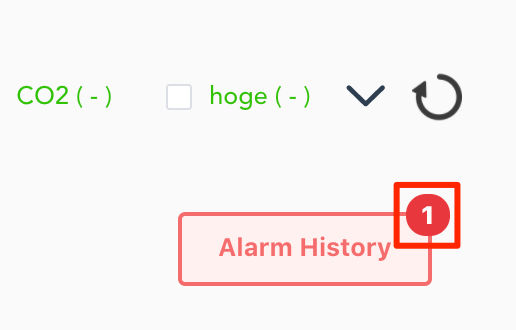
- Press [Alarm history] to check a list of alerting (up to 100 records).
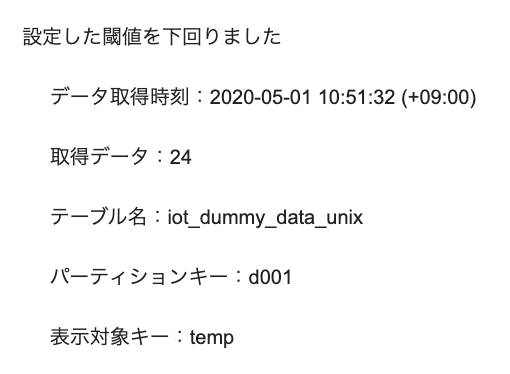
You can receive email notifications by setting emails.
-
If you specify the alert mail destination in the threshold setting, you can receive an email* of the alert notification when the value exceeds / below the threshold.
*In Japanese, sorry! English version coming soon. The image below is an example of the content of the alert mail.
Note: you can receive emails only while you are on the IoT.kyoto VIS page.
[Option 3] Search past data
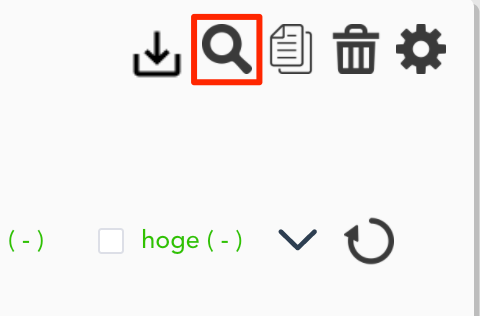
1. Go to the past data search.
- Press the [Search] (magnifying glass) icon on the graph panel of which you want to search past data.
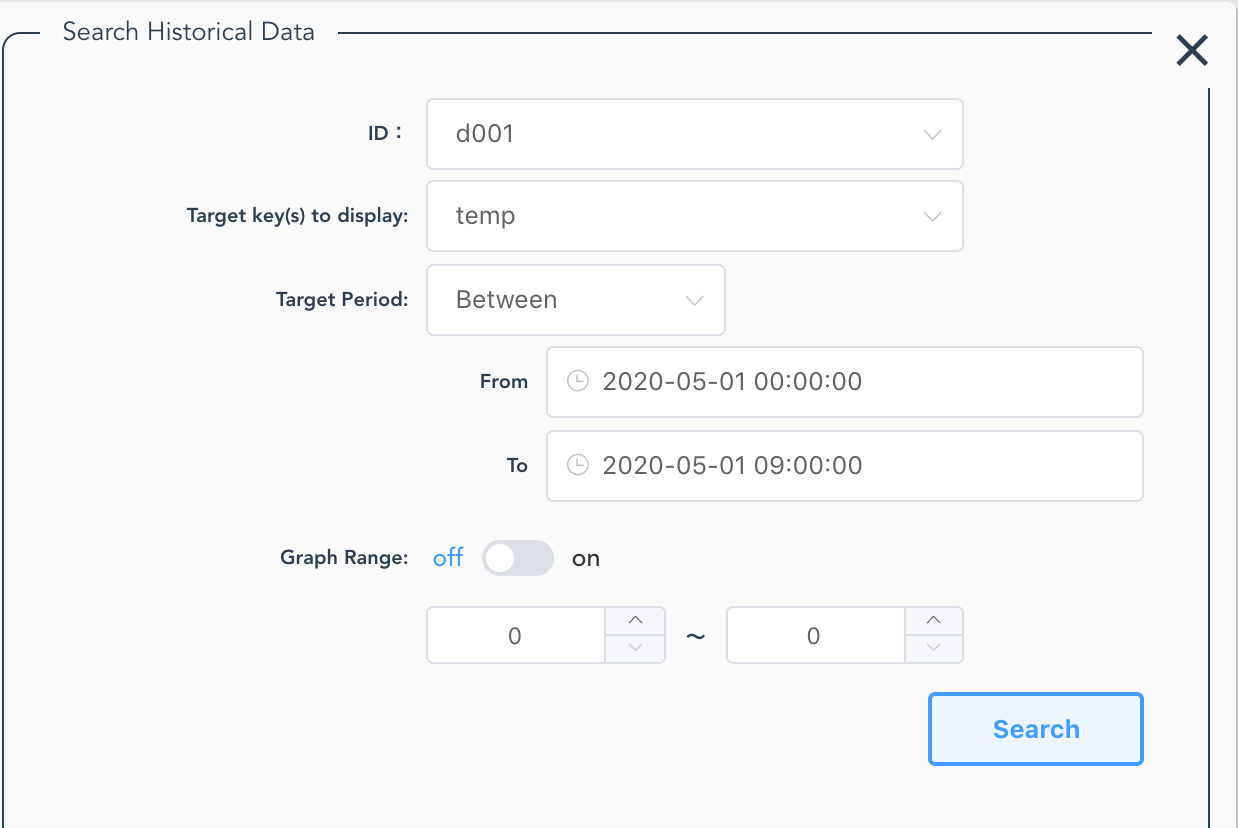
2. Fill in the search conditions.
- Select the device and the target key you want to see the past data.
- Specify the date and time of data.
- You can specify duration with “before” or “after” key, or by choosing a start and end of the period.
- If you want to set the vertical axis range of the search result graph, set the range setting to “on” and enter numerical values.
3. Get the graph.
- You can get the data and display the graph by pressing [Search].
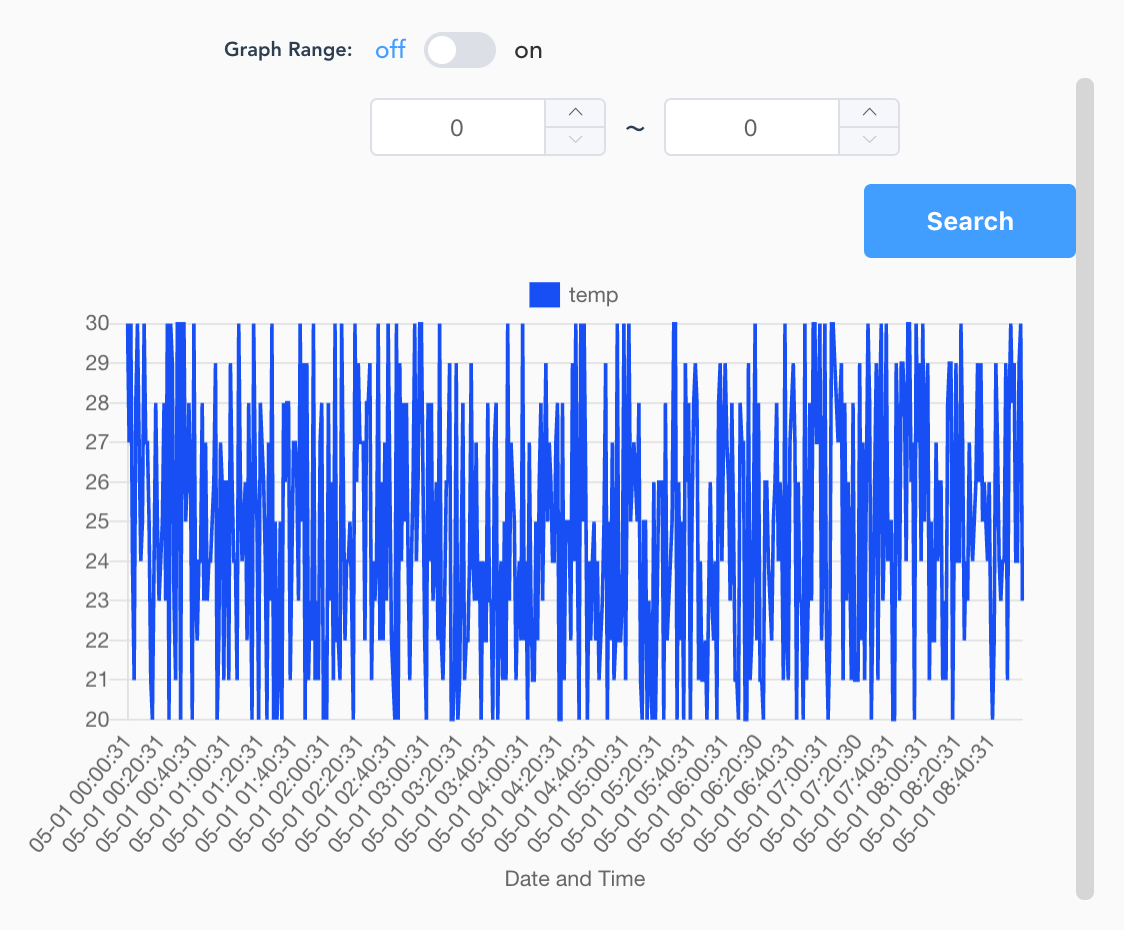
Note: data acquisition may fail depending on the read capacity of the referenced DynamoDB table; please narrow the search target period or adjust the read capacity of the DynamoDB table in this case.
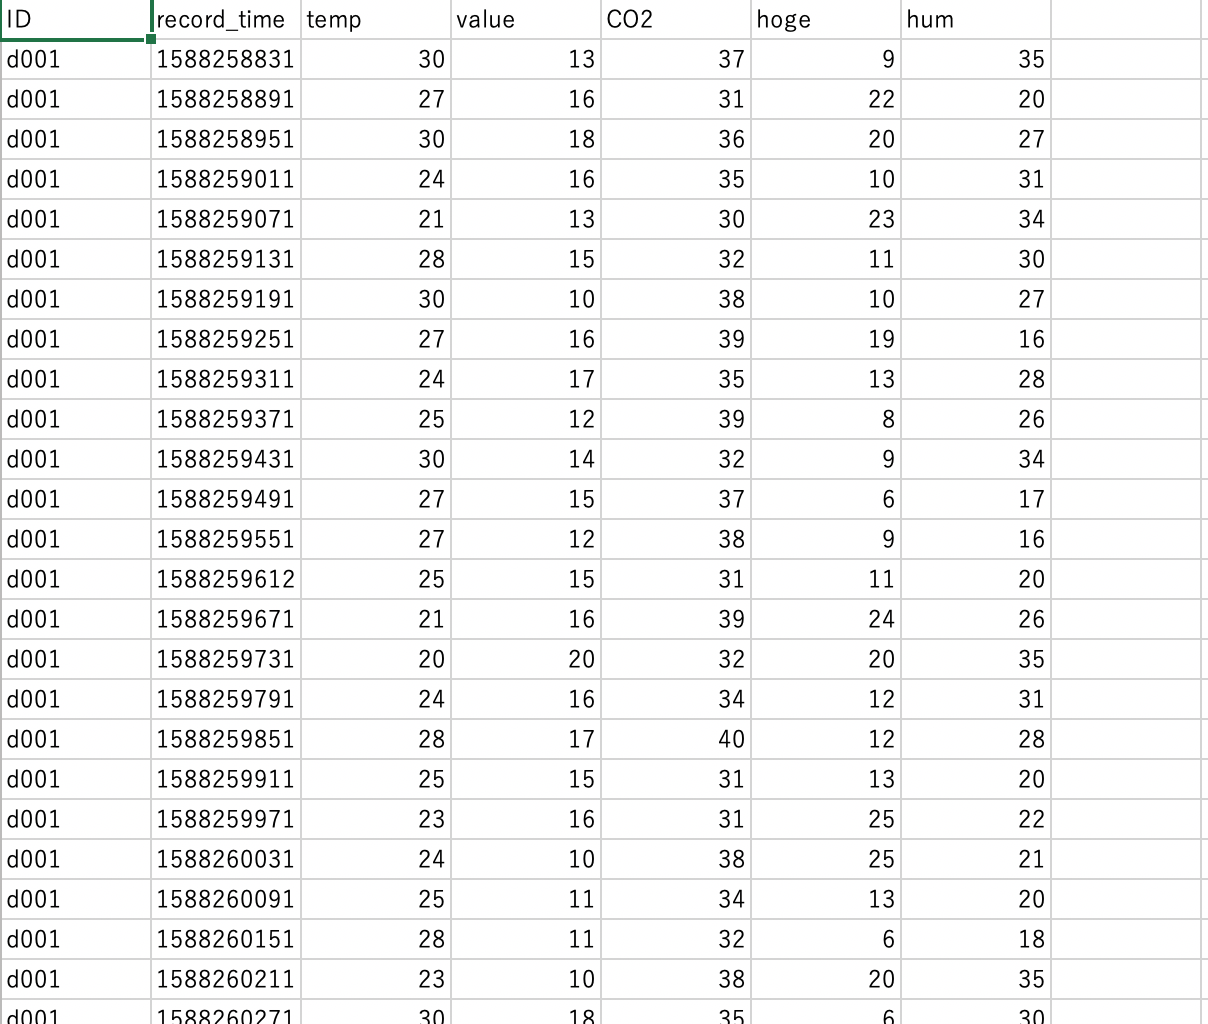
[Option 4] Download data in CSV file
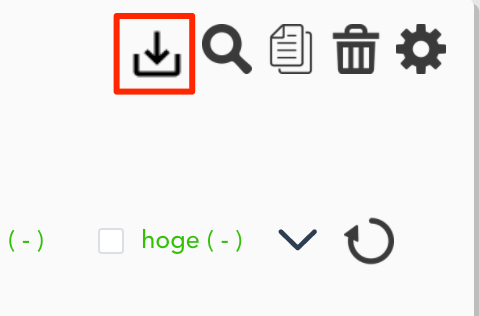
1. Go to the CSV download.
- Press the [Download data as CSV] icon on the graph panel of which you want to download data as a CSV file.
2. Specify the IoT device and the target period.
- Select the device from the selector
- Set the download target period
- You can specify duration with “before” or “after” key, or by choosing a start and end of the period.
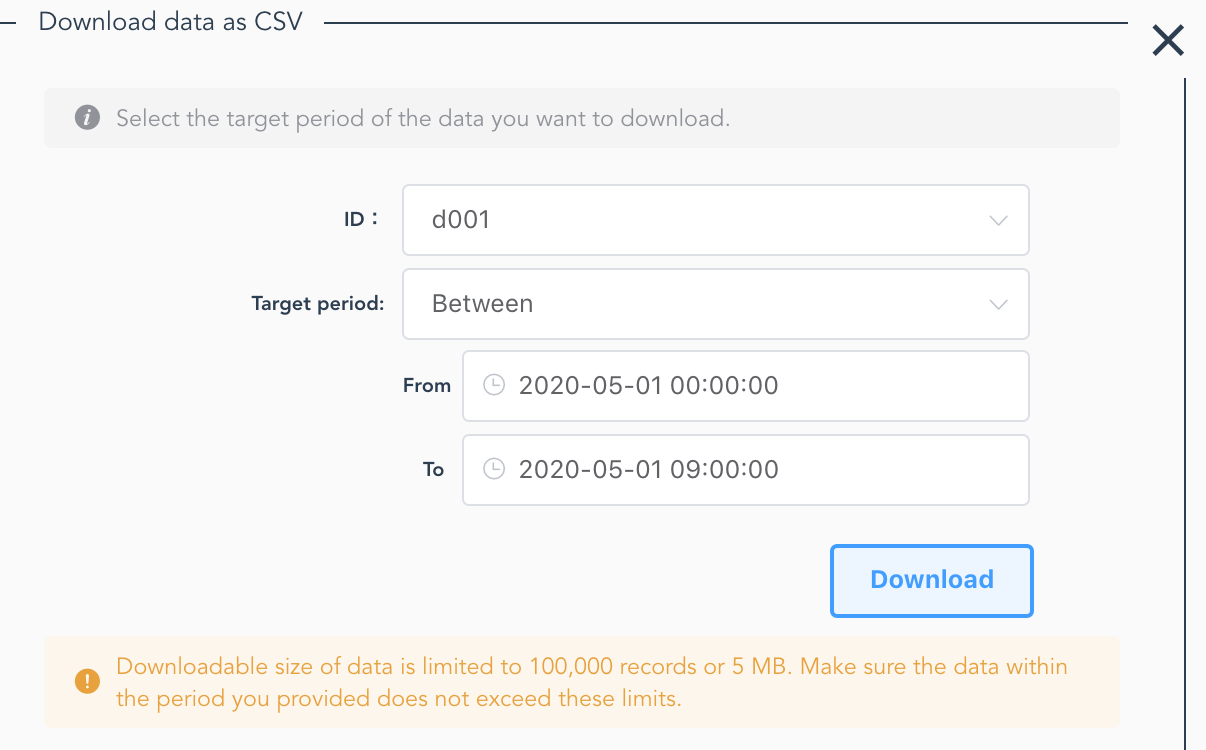
3. get a CSV file.
- Press [Download] to get a CSV file of the data that meets the conditions you speficied.
Note: data download may fail if number of record exceeds 50,000 or the data size is over 5MB; please adjust the target period in this case.
Note: depending on the read capacity of the target DynamoDB table, the data acquisition may fail even if the target data size does not exceed the limitations; please adjust the target period or read capacity of DynamoDB table in this case.
[Option 5] Rearrange panels
This feature is available only when you have multiple graph panels.
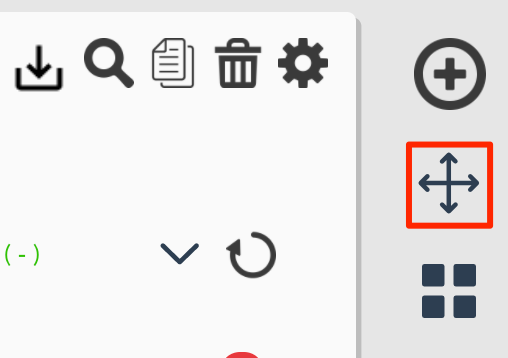
1. Switch to panels sort mode.
- Press the [Rearrange panels] (crossing arrows) icon at the top right of the page.
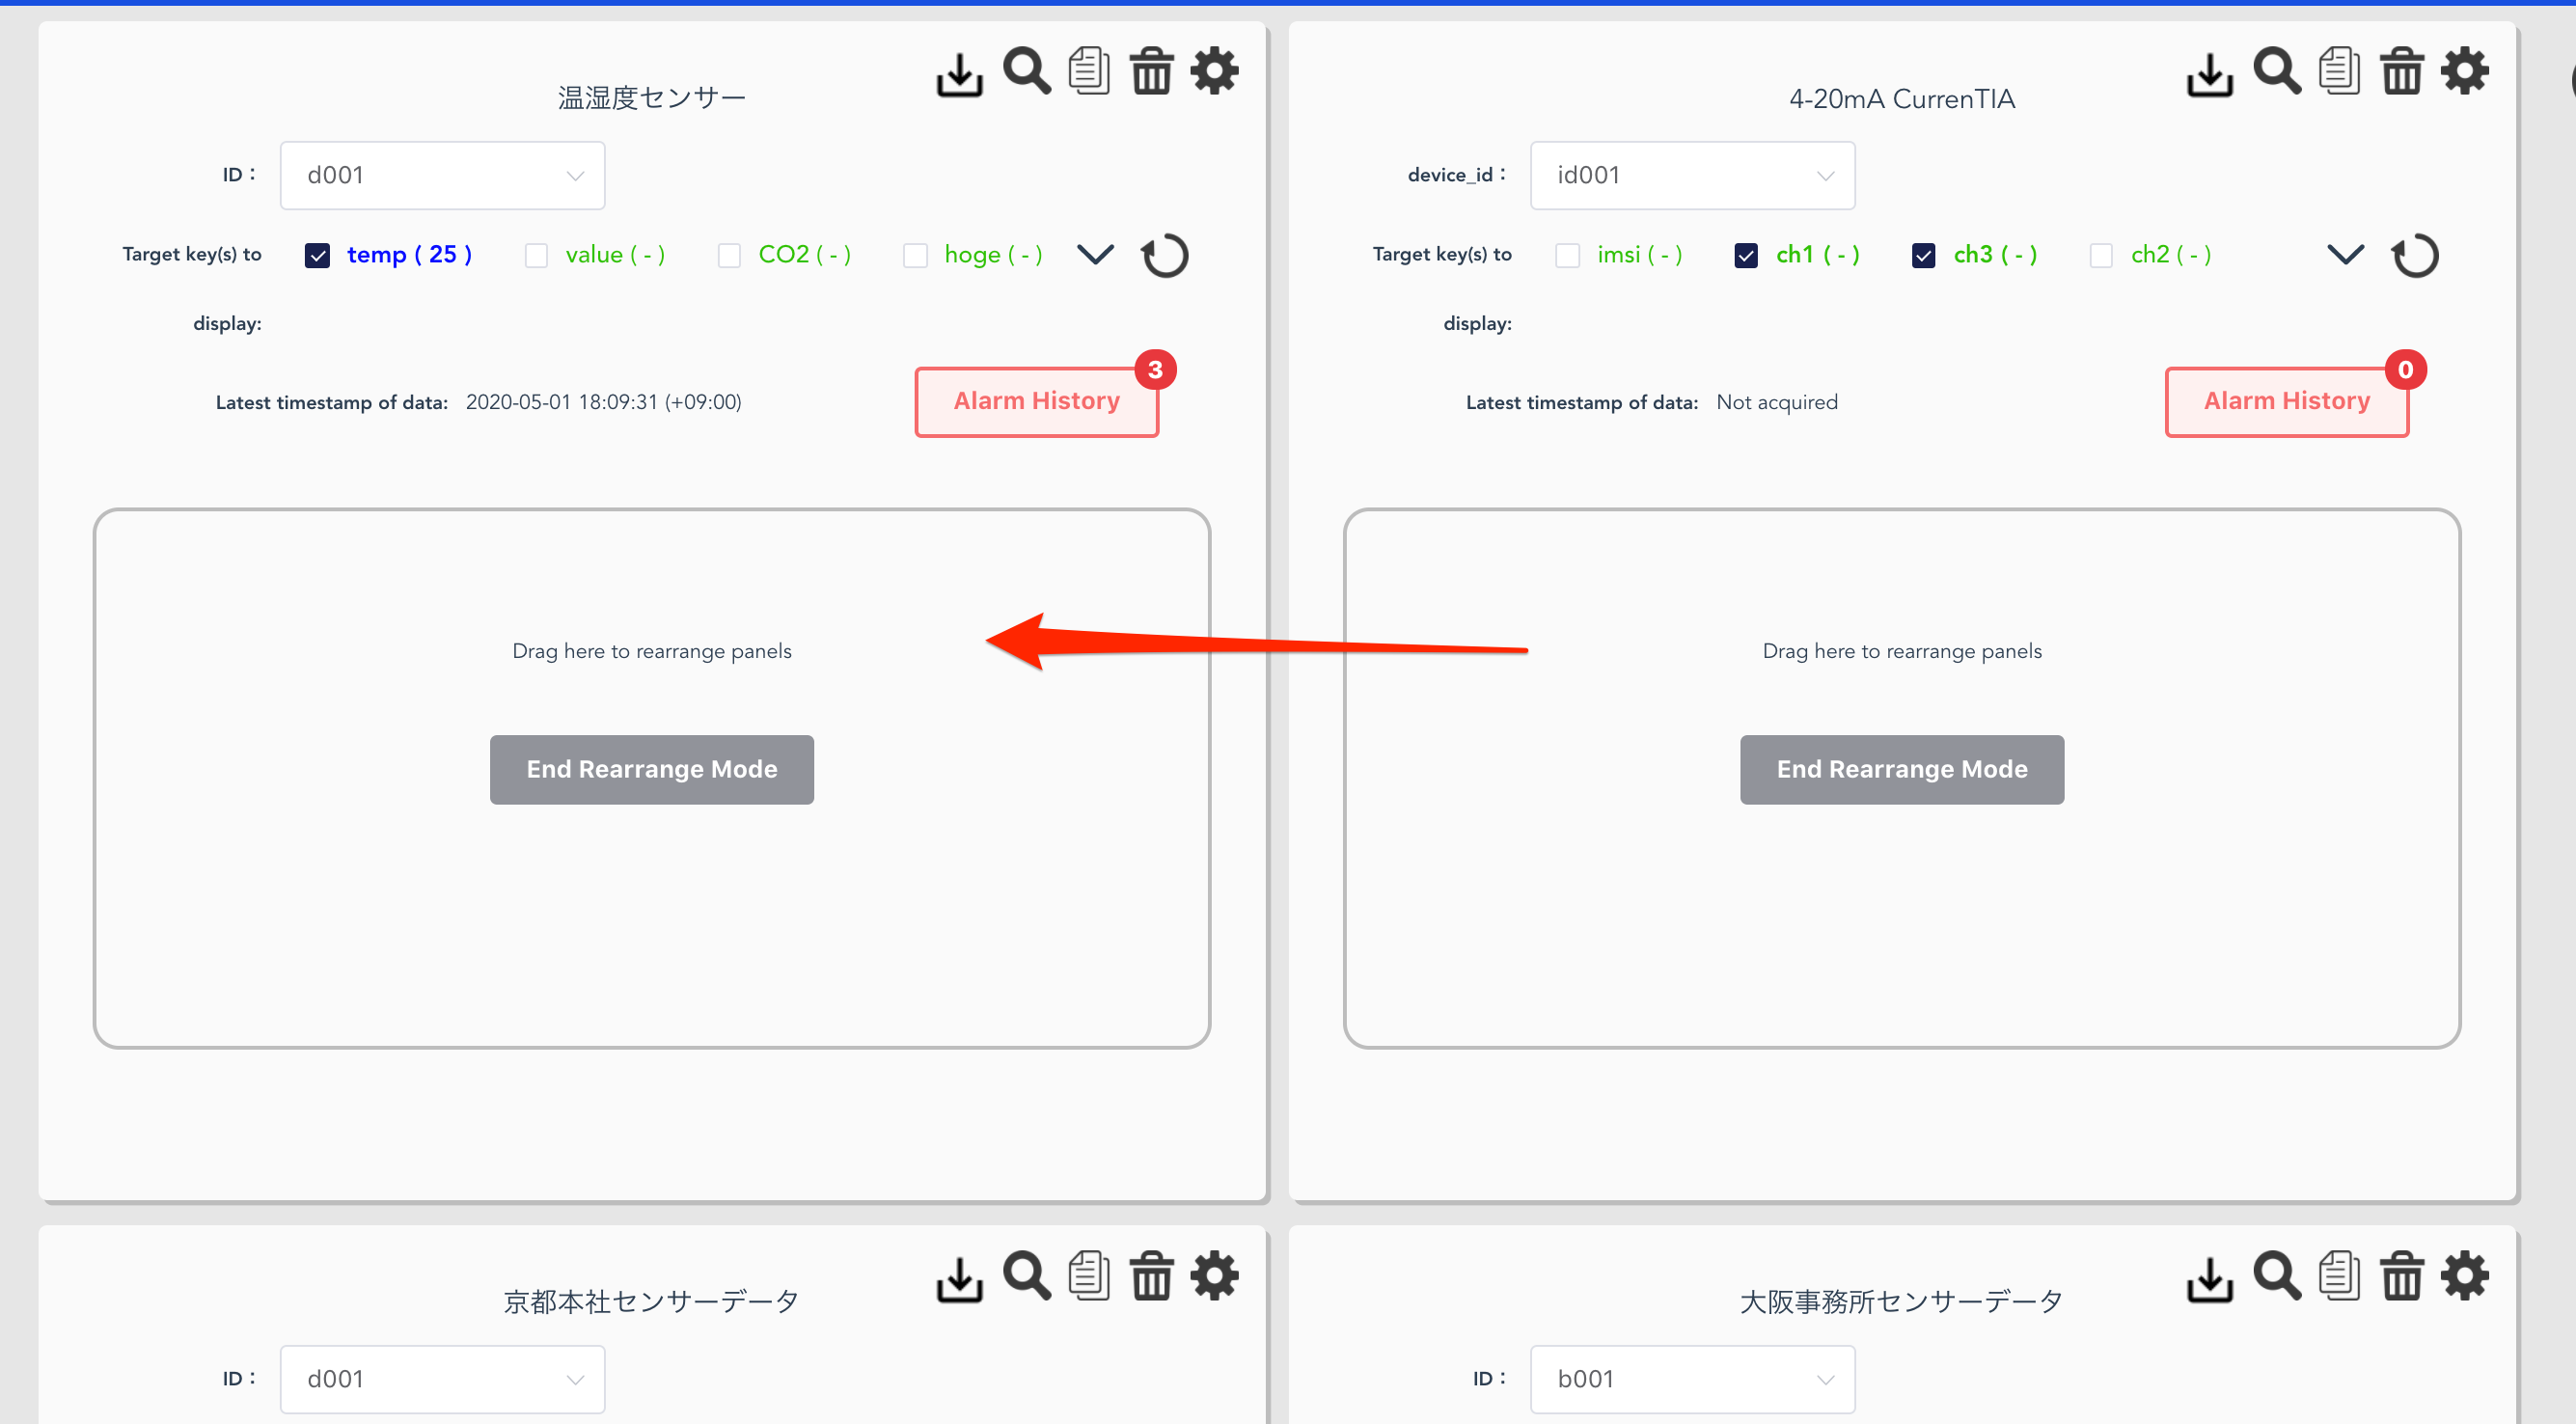
2. Sort graph panels.
- You can drag and drop a panel; drag inside a marked area which says [Drag here to rearrange panels].
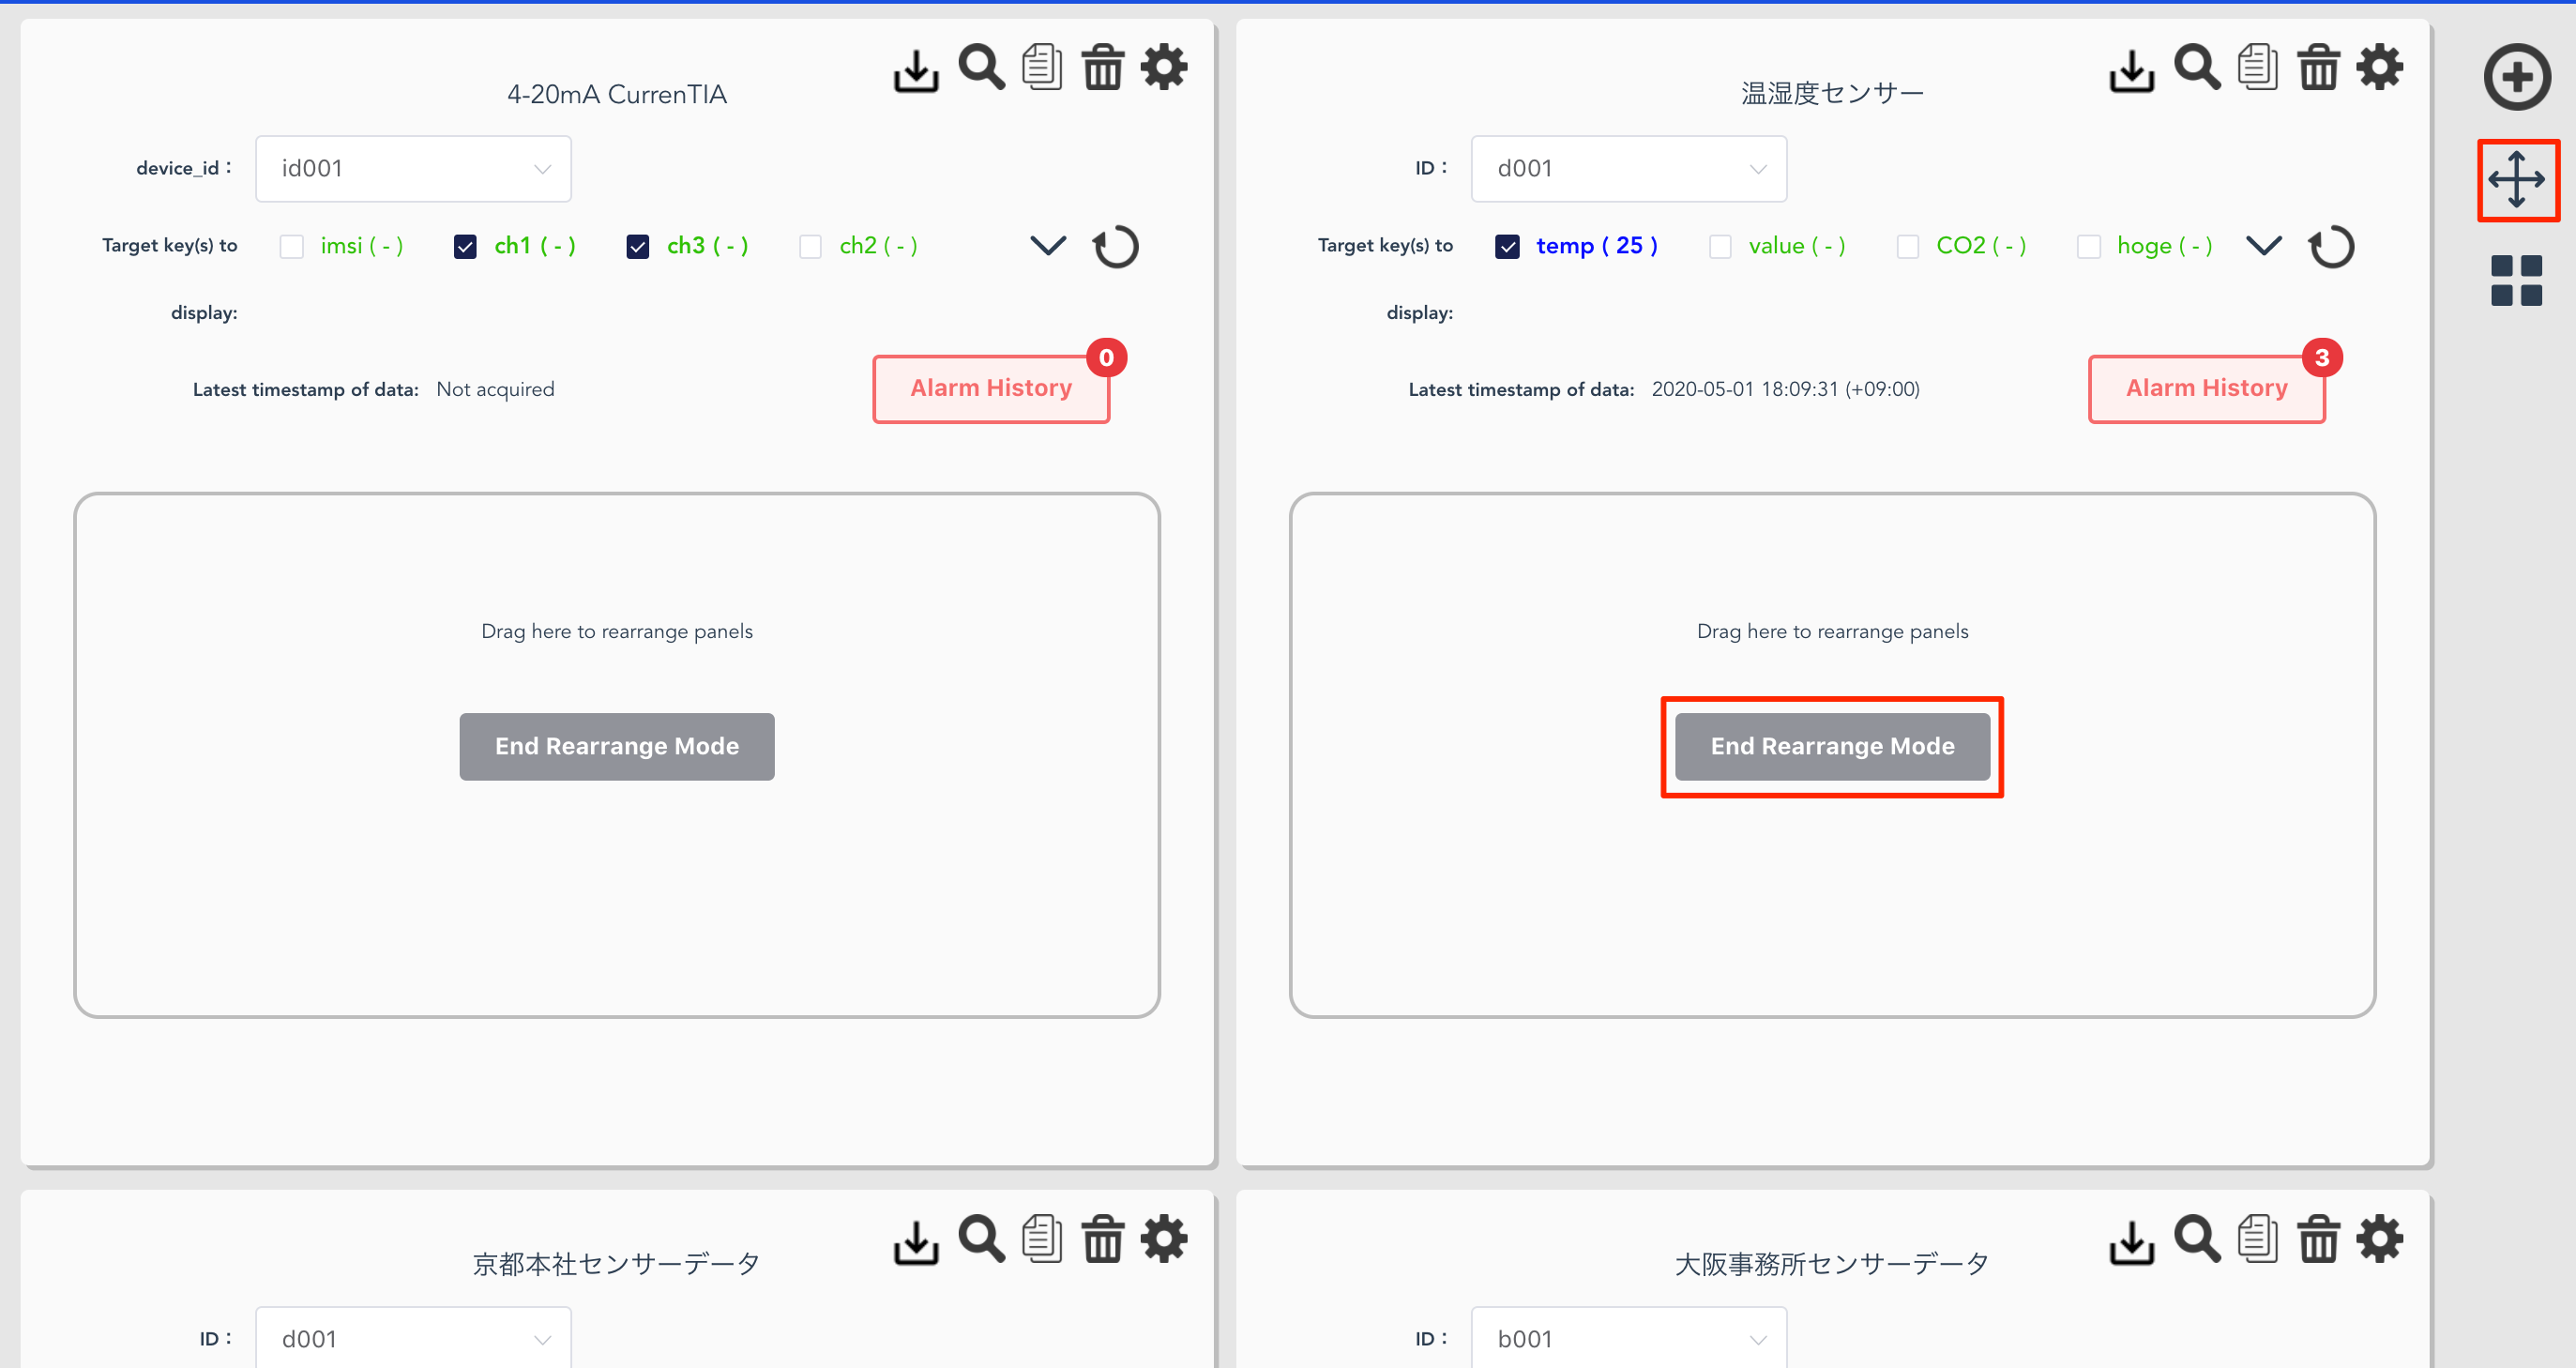
3. Exit sort mode.
- End sorting mode by pressing either [End Rearrange Mode] on one of the graph panels or the [Rearrange panels] (crossing arrows) icon pressed in 1.
[Option 6] Delete graph
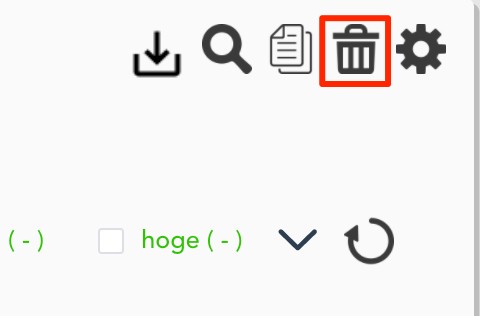
1. Press the [Delete This Graph] button.
- Press the [Delete this graph] (trash can) icon on the graph panel of which you want to delete.
2. Delete the graph.
- The alert dialog pops up as you pressed the icon; if there is no problem in deleting, press [OK].
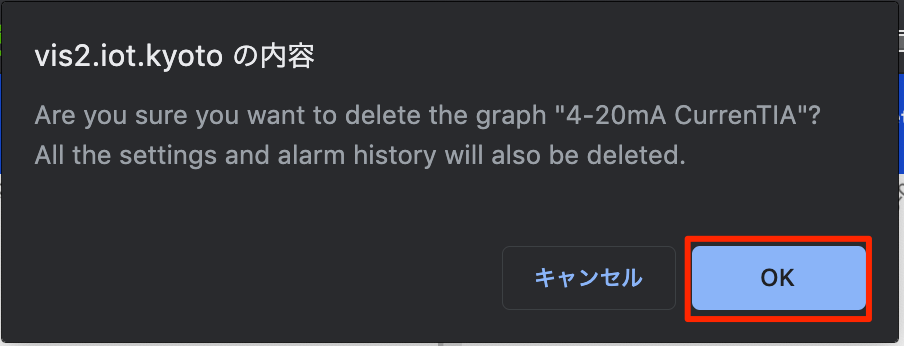
Note: after confirmation, the settings of the graph may also be deleted.